Patterns and Drivers of Health Spending Efficiency

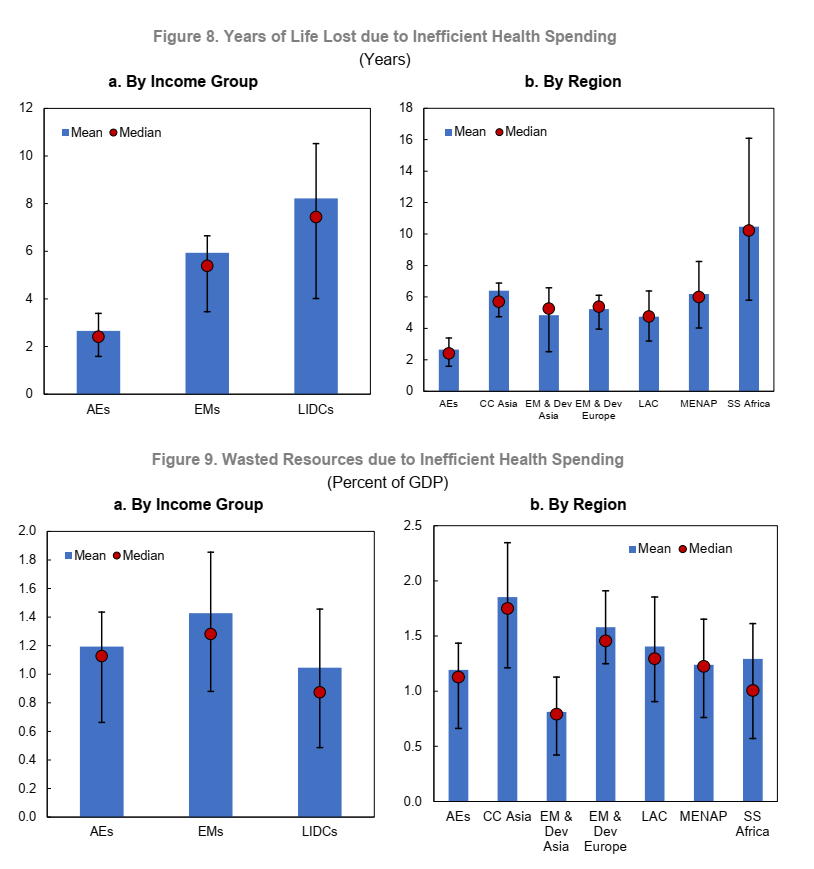
Health issues are high on public policy agenda. Health-related Sustainable Development Goals are yet to be achieved, COVID-19 pandemic is still on, and ageing population requires additional health services. Demands for health expenditures are at an all-time high all across the globe, while the fiscal space is limited. Not surprising, policymakers focus attention on ensuring that resources are used efficiently. This chart of the week shows losses—in terms of years of life and percent of GDP—due to health spending inefficiencies. It comes from the recent IMF Working Paper “Patterns and Drivers of Health Spending Efficiency”, which considers input- and output-oriented measures of (in)efficiency, depending on country distance from the frontier of expenditures-life expectancy.

The paper explores other patterns in efficiency across income groups, regions, and time, and the fiscal and years-of-life losses due to how health resources are spent. It goes further in exploring the question of drivers of health expenditure inefficiency, focusing on three major drivers: universal health coverage with essential services, income distribution, and corruption.

Universal health coverage is a crucial driver of health efficiency. If each country were to achieve, for each policy variable, the 75th percentile of its income group, low-income developing countries (LIDCs) would on average benefit from an increase of 3.4 years of life, while emerging markets (EMs) would gain 2.2 life years. Measured in expenditures savings, EMs and LIDCs to benefit from 0.39 and 0.37 percent of GDP. A more equitable distribution of income brings lower but still substantial gains in life expectancy by 1.7 and 2.1 years for EMs and LIDCs, respectively—or bring in savings of 0.17 and 0.12 percent of GDP. Better control of corruption is important, especially for EMs, which can benefit from an additional 1.6 years of life expectancy or avoid the waste of 0.27 percent of GDP in health spending. LIDCs gain 0.7 years of life expectancy or save 0.1 percent of GDP.

The Economics of Fertility: A New Era

Poor families (and countries) tend to have more children. Women have to choose between work and children. These two empirical regularities have held for quite long. The economics of fertility has entered a new era because these stylized facts no longer universally hold—according to a recent IZA working paper “The Economics of Fertility: A New Era”.

The chart of the week shows one of the underlying factors—sharing household burden. The sample of OECD countries shows strong positive correlation between fair sharing of household work and total fertility rate.

According to the research, in high-income countries, the income-fertility relationship has flattened and—in some cases—reversed. The cross-country relationship between women’s labour force participation and fertility is now positive.

There is a number of new theories, explaining the compatibility of women’s career and family goals—a key driver of fertility. Four common factors facilitate combining a career with a family: (i) family policy; (ii) cooperative fathers; (iii) favourable social norms; and (iv) flexible labour markets.

These things don’t come automatically, investments in social care could make difference. Time poverty could hold back women labour market participation, even if other factors are favourable. Researchers suggest that public investment in the social care services sector have a significant multiplicative effect and create jobs in other sectors. The new economics of fertility hints that now there is no inevitable trade-off between women empowerment and fertility.

Upside down map?

This chart of the week shows map of the World as seen from Australia, in Hobo-Dyer projection. Quite unfamiliar view, if you live in Europe—like I do—and are accustomed to Europe-centered, North on the top, Mercator projection maps.

Any map is a model of reality, imperfect representation of things, based on a set of assumptions and conventions. Mercator projection is very useful for certain purposes and it was invented for them. It is preserving angles, and thus local directions and shapes, making it indispensable for navigation. North on the top, South on the bottom is a useful convention. However, it comes with a cost—it inflates the size of objects away from the equator. Russia, Canada, and especially Greenland and Antarctica look much bigger than they are. XCKD jokingly proposed a Madagascator projection, which designed solely to exaggerate size of Madagascar through using unorthodox specifications of projection).

We keep similar mental maps for many things and navigate them so routinely, that we take assumptions and conventions for granted. Navigating complex issues requires comparing and aligning our mental maps. Such a comparison could help us to see the issue on various maps and find a joint way forward.

Maping ecosystem services contribution to SDGs for Small Island Developing States

Marine and coastal ecosystem services play cruicial role in the economy and well-being in Small Island Developing States. These services could contribute to common challenges in achieving the Sustainable Development Goals. Fact-based solutions, based on linking ESS and SDGs, are essential for nature conservation and sustainable development in SIDS. The recent study developed an approach to capture the contribution of ESS to the achievement of SDGs in Aruba.

The study quantitatively capture the contribution of three ESS to the achievement of priority SDG targets, as well as interlinkages between priority SDG targets. Lack of data for many of the ESS is an issue widely by local stakeholders in Aruba. A shortlist of indicators provided appropriate metrics of the socio-economic value of fisheries and socioeconomic data on nature-based tourism. This chart, a hotspots maps provides information on how Arubans perceive the importance of nature for cultural and recreational activities and their well-being.

#SIDS #ESS #ecosystemservices #SDGs #SDG14 #chartoftheweek #Aruba

Networks and diffusion of agricultural innovations

Dissemination of improved technologies could play crucial role in increasing productivity in agriculture. Extension services, provided by governments and other organizations, could address existing information barriers by providing recommendations for increasing agricultural productivity and yields. Trained farmers may disseminate knowledge further to their peers. Hence, social networks could play an important role in this process—thanks to credibility of contacts and knowledge of local conditions.

This chart of the week from the recent UNU-WIDER Working Paper shows different types of networks in one village in Guinea-Bissau. The research brings several important conclusions. It confirmed that that agricultural information diffuses along social network links from project participants to non-participants. Different types of networks play different role. While chatting network connects virtually all families in village, farmer’s financial support networks are most relevant for information diffusion. Weak social links appear to be as important as strong links in the dissemination of agricultural knowledge. Finally, project has impact on farmers’ communication network, which expanded because of training.

Rute Martins Caeiro. Diffusion of agricultural innovations in Guinea-Bissau. From learning to doing. WIDER Working Paper 7/2022

Skills for Green Jobs Transition

Every crisis is an opportunity. The Great Reshuffle and post-COVID recovery present an opportunity for the green transition and activating the jobs. However, LinkedIn’s Global Green Skills Report suggests that we face a number of challenges. This chart shows one of them. The current pace of transitions into green and greening is too slow. According to LinkedIn data, for every 10,000 workers leaving a Not Green job, only 1 moves into a Green job.

One possible accelerator of transition is skills formation. Recent publication by the European Training Foundation “The future of skills: A case study of the agri-food sector in Morocco” provides a glimpse into future of skills. Trends like automation, digitisation, global trade, competition, climate change, sustainable farming and changing consumer behaviour put a pressure on the agri-food sector, which has relied upon traditional technologies and skills.
No doubts, the forthcoming radical changes will affect jobs, by creating new ones or transforming existing ones. For instance, the boundaries between disciplines call for entirely new professions, like environmental economist or nutritionist engineer. In general, these changes imply introduction, use, and maintenance of new technologies, and more interactions with people from different disciplinary or professional backgrounds. From the skills point of view, this mean increase in demand for multi-disciplinary competences and the ability to cooperate and interact with people from different backgrounds.
This could be done by improving collaboration between education providers and companies, enhancing continuing training and reskilling and upskilling, and structuring learning courses around certain value chains.

Food Crisis and Role of Social Protection

The 2022 is going to be a very difficult year for the global food system, due to disruption of supplies and effects of sanctions caused by Russia’s invasion of Ukraine. This chart from UNU-WIDER suggests that a food crisis was brewing even before the Ukraine war.

A combination of factors could make it much worse than hikes of 2008 and 2011-2012

1️⃣ This time it is compounded and still unfolding—we witness growing prices for cereals AND fuels AND fertilizers. Worst yet to come. Between 2019 and March 2022, cereal prices already has increased by 48%, fuel prices by 86% and fertiliser prices by 35%. Food, fuel and fertiliser prices could stay high for years if the war in Ukraine protracts and the isolation of Russia’s economy tightens

2️⃣ The poor are still recovering from the COVID-19 crisis, which had the most severe economic impact on the urban poor. Food price inflation is higher than CPI in many countries of the world, hurting the most vulnerable

3️⃣ Governments have little room to manoeuvre, due to shrinking tax base and growing dets debts for the unprecedented protection for households and businesses during the pandemic.

▶ What could be done?

Most impactful measures are increasing food supply and increasing fuel supplies to help bring down fuel and fertiliser (inter alia through resolving logistical bottlenecks and reducing shipping costs). However, it is not clear if countries are willing and ready to implement these measures.

Social protection could provide necessary support, via food or financial aid. These measures require concerted efforts of international institutions, governments, local actors, NGOs and the private sector. International community must help governments, facing tough post-pandemic fiscal circumstances, to mobilize resources for social protection. Combining universal programs with targeted programs could help to make the most of constrained fiscal space. World Bank real-time review of social protection and jobs responses to COVID-19 documented 3,856 social protection and labor measures planned or implemented by 223 economies Advanced big-data-driven technologies, like artificial intelligence and machine learning, could help in better targeting. However, they should be complemented with thick data and human solidarity to ensure proper combination of empowerment and protection.

How COVID-19 caused a global learning crisis

COVID-19 can undermine life-long perspectives of young people. Students globally lost eight months of learning and the impact varies widely from staggering 12 months in South Asia and Latin America and Caribbean to modest 4 months in North America and Europe and Central Asia. Recent McKinsey study identifies three archetypes of countries:
🚩 Most affected countries with moderate levels of pre-COVID-19 learning and significant delays in education, where students may be nine to 15 months behind.
🚩 Prepandemic-challenged countries, with very low levels of pre-COVID-19 learning, where losses were daunting but not so dramatic in absolute terms, about three to eight months
🚩 Least affected are high-performing countries, with relatively high levels of pre-COVID-19 performance, where losses were limited to one to five months.

Lower levels of learning translate into lower future earnings potential for students and lower economic productivity for nations (📉 losing 1 percent of global GDP annually, according to McKinsey estimates). By using scenario modelling UNDP came to similar conclusions. The study shows how governments can make choices today that have the greatest potential to boost progress in the future. School systems can respond across multiple horizons to help students get back on track: ⭐Resilience, 🔁Reenrollment, 🔼Recovery, and 💡Reimagining.

Do we measure right inequalities

Can we consider any society developed if the people have a deep sense of unfairness and believe that the ‘system is rigged’? Recent chapter by Avidit Acharya and John E. Roemer in “The Great Upheaval” argues that fairness entails equalizing opportunities rather than equalizing something else.

However, do we measure what matters?

In the end, all inequalities are unequal, but some are more unequal than others. We still use only one indicator—the Gini coefficient of income inequality—to judge them all. This chart illustrates possible approach in measuring equality of opportunity. It shows distributions of income among people, grouped by the levels of education of their two parents. These curves summarize the income opportunities available to its members. Inequality of opportunity for income appears to be a good deal higher in Indonesia than in Germany around a similar time. Measuring right inequalities could help policymakers to shape right policies.

New-old human-machine interactions

Nowadays we store more than 99% of information in digital form, comparing to just 1% a couple of decades ago. Just 60% of Internet traffic is currently generated by human, the rest is coming from bots, good 15% and bad 25%. This is a new reality, which pose a lot of questions–how we, human, interact with algorithms? with each other using the technologies? what does this mean for human development and human security? This video illustrates new-old interactions–a grandma helping a small robot to cross a street, by holding cars.