Dissemination of improved technologies could play crucial role in increasing productivity in agriculture. Extension services, provided by governments and other organizations, could address existing information barriers by providing recommendations for increasing agricultural productivity and yields. Trained farmers may disseminate knowledge further to their peers. Hence, social networks could play an important role in this process—thanks to credibility of contacts and knowledge of local conditions.
This chart of the week from the recent UNU-WIDER Working Paper shows different types of networks in one village in Guinea-Bissau. The research brings several important conclusions. It confirmed that that agricultural information diffuses along social network links from project participants to non-participants. Different types of networks play different role. While chatting network connects virtually all families in village, farmer’s financial support networks are most relevant for information diffusion. Weak social links appear to be as important as strong links in the dissemination of agricultural knowledge. Finally, project has impact on farmers’ communication network, which expanded because of training.
The unemployment rate is a headline indicator, widely reported and used in policy debates. However, low unemployment rates could mask reality and underestimate under_employment.
The unemployment rate shows the percentage of people in the labour force who (i) do not have a job, (ii) are looking for one; and (iii) available to start a job. This is a set of questions, asked in a questionnaire of Labour Force Survey, the primary source of labour data nationally and globally. People, who have a job, are employed, so the unemployment rate doesn’t care about them. In a similar vein, people, who are outside of labour forces, assumed to lost connection with labour market, quit the job search and not ready to take a job. However, these assumptions could be wrong. People could work less hours than desired, be discouraged to continue job search.
Since 2013 ILO has been collecting and publishing data on underemployment, which includes three measures. One is the combined rate of time-related underemployment—persons in employment whose working time is insufficient in relation to alternative employment situations in which they are willing and available to engage—and unemployment (LU2). Another is the combined rate of unemployment and the potential labour force—persons who are not in employment, while express an interest in it, for whom existing conditions limit their active job search and/or their availability (LU3). The broadest composite rate of labour underutilization (LU4) includes all three categories, time-related underemployment, unemployment and the potential labour force.
Chart below shows these rates for countries in Europe and Central Asia. The picture varies by countries, however there are three common points here:
Underemployment rates are much higher than traditional unemployment rates. For instance, in cases of Kosovo*, Georgia, Armenia there is huge number of people out of labour force, who would like to work, but limited by circumstances. Contrary, in Montenegro, Azerbaijan, Albania, there is significant time-related underemployment.
These differences call for a systemic approach in tackling un_ and under_employment, taking into account local conditions. Lack of affordable transportation could be an obstacle in some urban areas, while lack of housing could be a limiting factor in other urban areas.
One form of labour underutilization is a skill-related inadequate employment, resulting from imbalances between skills offered by workers and those needed for jobs. We need a flexible and forward-looking approach to skills formation, which should combine traditional learning approaches with practical application during apprenticeship or internship.
LU2 is the combined rate of time-related underemployment and unemployment. LU3 is the combined rate of unemployment and the potential labour force. LU4 is the composite rate of labour underutilization. Reference year for the unemployment rate and may differ for LU2-LU4. Data from ILOSTAT https://ilostat.ilo.org/topics/unemployment-and-labour-underutilization/
Every crisis is an opportunity. The Great Reshuffle and post-COVID recovery present an opportunity for the green transition and activating the jobs. However, LinkedIn’s Global Green Skills Report suggests that we face a number of challenges. This chart shows one of them. The current pace of transitions into green and greening is too slow. According to LinkedIn data, for every 10,000 workers leaving a Not Green job, only 1 moves into a Green job.
One possible accelerator of transition is skills formation. Recent publication by the European Training Foundation “The future of skills: A case study of the agri-food sector in Morocco” provides a glimpse into future of skills. Trends like automation, digitisation, global trade, competition, climate change, sustainable farming and changing consumer behaviour put a pressure on the agri-food sector, which has relied upon traditional technologies and skills. No doubts, the forthcoming radical changes will affect jobs, by creating new ones or transforming existing ones. For instance, the boundaries between disciplines call for entirely new professions, like environmental economist or nutritionist engineer. In general, these changes imply introduction, use, and maintenance of new technologies, and more interactions with people from different disciplinary or professional backgrounds. From the skills point of view, this mean increase in demand for multi-disciplinary competences and the ability to cooperate and interact with people from different backgrounds. This could be done by improving collaboration between education providers and companies, enhancing continuing training and reskilling and upskilling, and structuring learning courses around certain value chains.
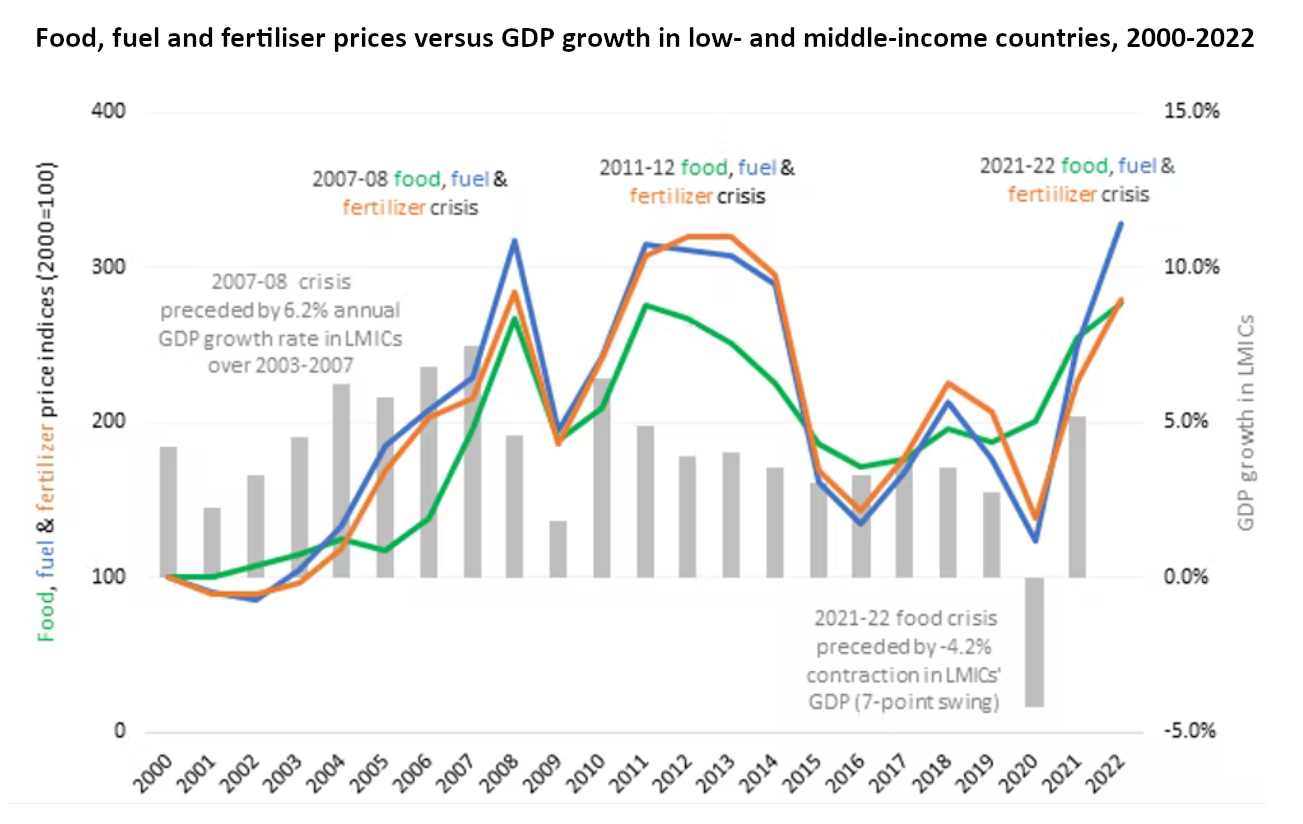
A combination of factors could make it much worse than hikes of 2008 and 2011-2012
1️⃣ This time it is compounded and still unfolding—we witness growing prices for cereals AND fuels AND fertilizers. Worst yet to come. Between 2019 and March 2022, cereal prices already has increased by 48%, fuel prices by 86% and fertiliser prices by 35%. Food, fuel and fertiliser prices could stay high for years if the war in Ukraine protracts and the isolation of Russia’s economy tightens
2️⃣ The poor are still recovering from the COVID-19 crisis, which had the most severe economic impact on the urban poor. Food price inflation is higher than CPI in many countries of the world, hurting the most vulnerable
3️⃣ Governments have little room to manoeuvre, due to shrinking tax base and growing dets debts for the unprecedented protection for households and businesses during the pandemic.
▶ What could be done?
Most impactful measures are increasing food supply and increasing fuel supplies to help bring down fuel and fertiliser (inter alia through resolving logistical bottlenecks and reducing shipping costs). However, it is not clear if countries are willing and ready to implement these measures.
Social protection could provide necessary support, via food or financial aid. These measures require concerted efforts of international institutions, governments, local actors, NGOs and the private sector. International community must help governments, facing tough post-pandemic fiscal circumstances, to mobilize resources for social protection. Combining universal programs with targeted programs could help to make the most of constrained fiscal space. World Bank real-time review of social protection and jobs responses to COVID-19 documented 3,856 social protection and labor measures planned or implemented by 223 economies Advanced big-data-driven technologies, like artificial intelligence and machine learning, could help in better targeting. However, they should be complemented with thick data and human solidarity to ensure proper combination of empowerment and protection.
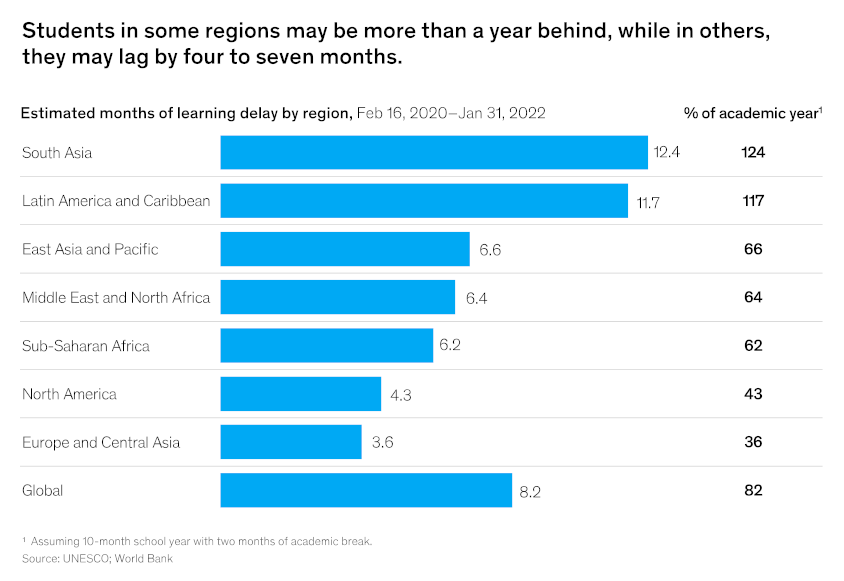
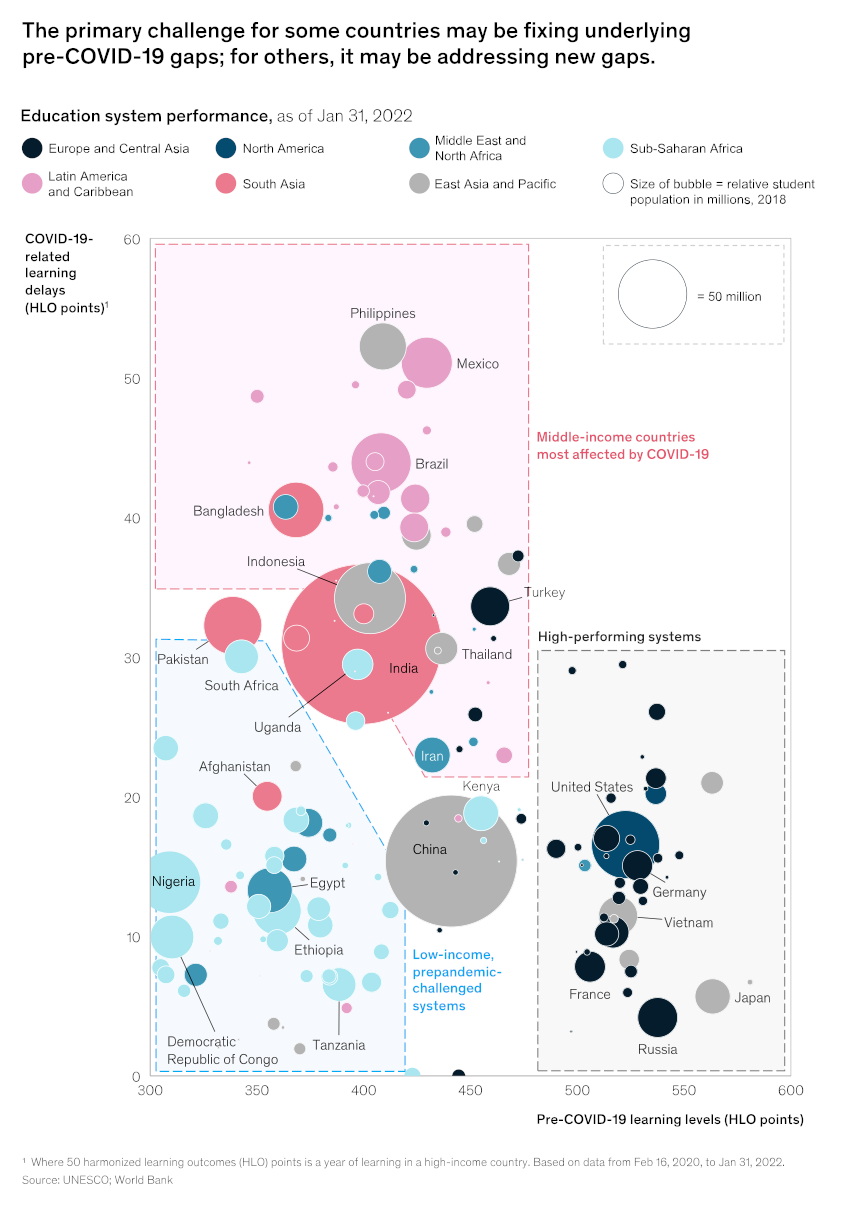
COVID-19 can undermine life-long perspectives of young people. Students globally lost eight months of learning and the impact varies widely from staggering 12 months in South Asia and Latin America and Caribbean to modest 4 months in North America and Europe and Central Asia. Recent McKinsey study identifies three archetypes of countries: 🚩 Most affected countries with moderate levels of pre-COVID-19 learning and significant delays in education, where students may be nine to 15 months behind. 🚩 Prepandemic-challenged countries, with very low levels of pre-COVID-19 learning, where losses were daunting but not so dramatic in absolute terms, about three to eight months 🚩 Least affected are high-performing countries, with relatively high levels of pre-COVID-19 performance, where losses were limited to one to five months.
Lower levels of learning translate into lower future earnings potential for students and lower economic productivity for nations (📉 losing 1 percent of global GDP annually, according to McKinsey estimates). By using scenario modelling UNDP came to similar conclusions. The study shows how governments can make choices today that have the greatest potential to boost progress in the future. School systems can respond across multiple horizons to help students get back on track: ⭐Resilience, 🔁Reenrollment, 🔼Recovery, and 💡Reimagining.
Can we consider any society developed if the people have a deep sense of unfairness and believe that the ‘system is rigged’? Recent chapter by Avidit Acharya and John E. Roemer in “The Great Upheaval” argues that fairness entails equalizing opportunities rather than equalizing something else.
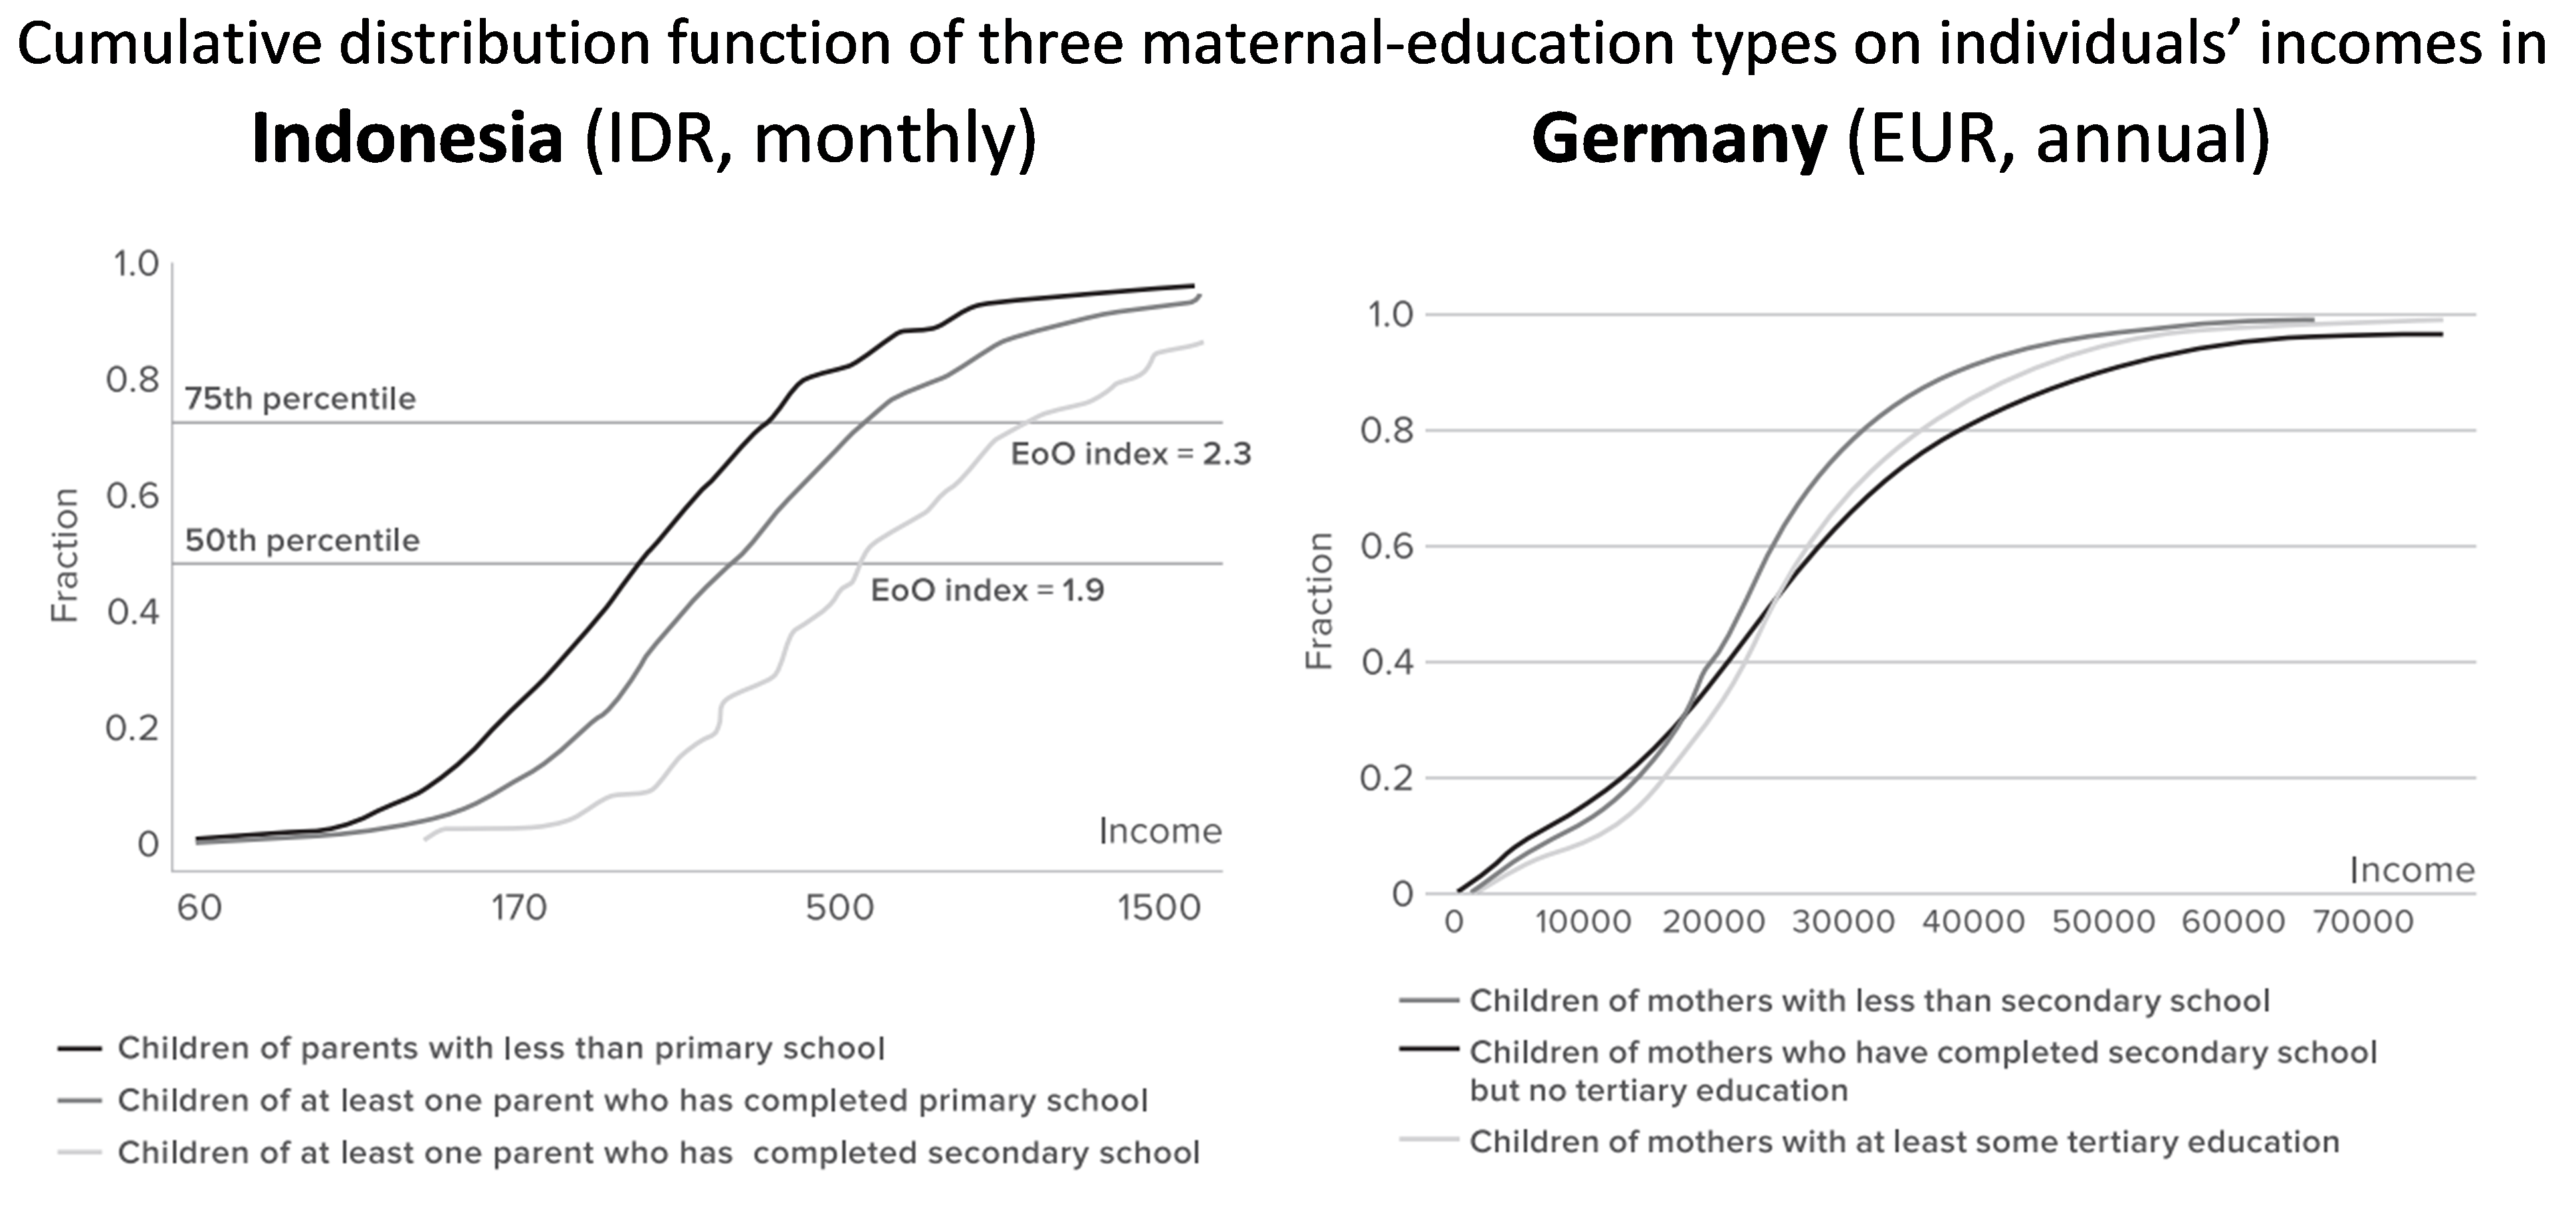
However, do we measure what matters?
In the end, all inequalities are unequal, but some are more unequal than others. We still use only one indicator—the Gini coefficient of income inequality—to judge them all. This chart illustrates possible approach in measuring equality of opportunity. It shows distributions of income among people, grouped by the levels of education of their two parents. These curves summarize the income opportunities available to its members. Inequality of opportunity for income appears to be a good deal higher in Indonesia than in Germany around a similar time. Measuring right inequalities could help policymakers to shape right policies.
Nowadays we store more than 99% of information in digital form, comparing to just 1% a couple of decades ago. Just 60% of Internet traffic is currently generated by human, the rest is coming from bots, good 15% and bad 25%. This is a new reality, which pose a lot of questions–how we, human, interact with algorithms? with each other using the technologies? what does this mean for human development and human security? This video illustrates new-old interactions–a grandma helping a small robot to cross a street, by holding cars.