 “Not all inequalities are created equal.” So goes one of the main takeaway messages from the Dialogue on Inequalities recently held in Istanbul.
Yet we still use only one indicator—the Gini coefficient of income inequality—to judge them all.
Back in 1968 Robert F. Kennedy said GDP “measures everything. . . except that which makes life worthwhile.” This holds true for the Gini coefficient as well—it measures all income inequalities, except that which make inequalities important for us.
All men, brother Gallio, wish to live happily, but are dull at perceiving exactly what it is that makes life happy (Seneca)
Life cannot be defined by income, just as quality of life cannot be measured with how much one get.
Yes, access to a good education and health care does matter. And different countries in the world have very different models of provision for these things. On the one side of the spectrum are heavily market-oriented countries, like the USA, Singapore and Hong Kong. On the other side, one could find such countries relying on state in public goods provision, as Sweden, France and Germany. Therefore, social inequalities are as worthy of discussion as the Gini.
Just look at Belgium and Bangladesh: They share, besides their first letter, a similar level of income inequality with a Gini index of 33. But when it comes to social inequalities, in education and health, Bangladesh performs four times worse than Belgium.
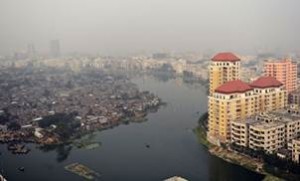
Dhaka, Bangladesh
Income Inequality Gini 32

Social inequality 29

|

Ghent, Belgium
Income Inequality Gini 33

Social inequality 7

|
Shared society
Perhaps what matters even more than income inequalities is the sense of shared society.
Singapore is a free market society, number one in “Doing Business” ranking, second in “Economic Freedom” score, with a very low tax rate. Not surprisingly, income inequality is quite high there, with a Gini score around 45.
However, Lee Kwan Yew, the founding father of modern Singapore seems to have managed “to give every citizen a stake in the country and its future.” People in Singapore trust each other and state institutions, and only a few would call for more equal income redistribution.
In contrast, countries in our region, despite relatively low income inequalities, do not perform well on this front. Recent findings highlight that in the most of the countries surveyed, the majority of people do not think that their interests are represented by the National Parliament or the regional and local administrations. Hence, one could suggest that this lack of shared society perhaps hurts people much more than differences in incomes.
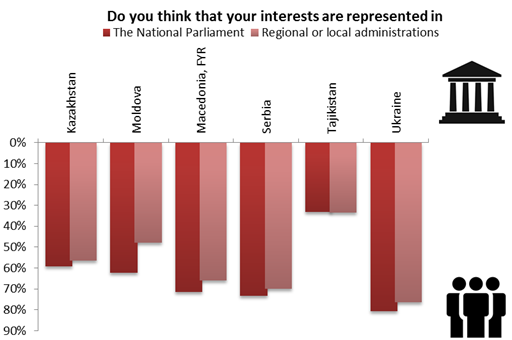
Source: Own calculations based on Regional Human Development Report, 2011
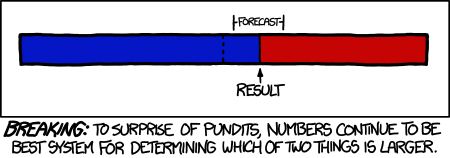
So how do we measure inequalities?
These days, inequalities are quite high on the development agenda.
Just look at the Open Working Group proposal for Sustainable Development Goals, which includes two goals on inequality.
So far, the proposal does not offer indicators for goals and targets. This could be an opportune moment to say goodbye to Gini and welcome some newcomers. In that case, keeping in mind what I’ve discussed above, let’s review some alternatives:
- The Palma ratio has recently been proposed as a more meaningful measure of inequality. It proposes to look at the income share of the top 10% divided by the income share of the poorest 40%. (Assumption confirmed by statistics is that middle income groups between the ‘rich’ and the ‘poor’ capture around half of the Gross National Income). In this way, Palma may be much better at capturing excessive inequalities, or as we call it, “the bad and the ugly”.
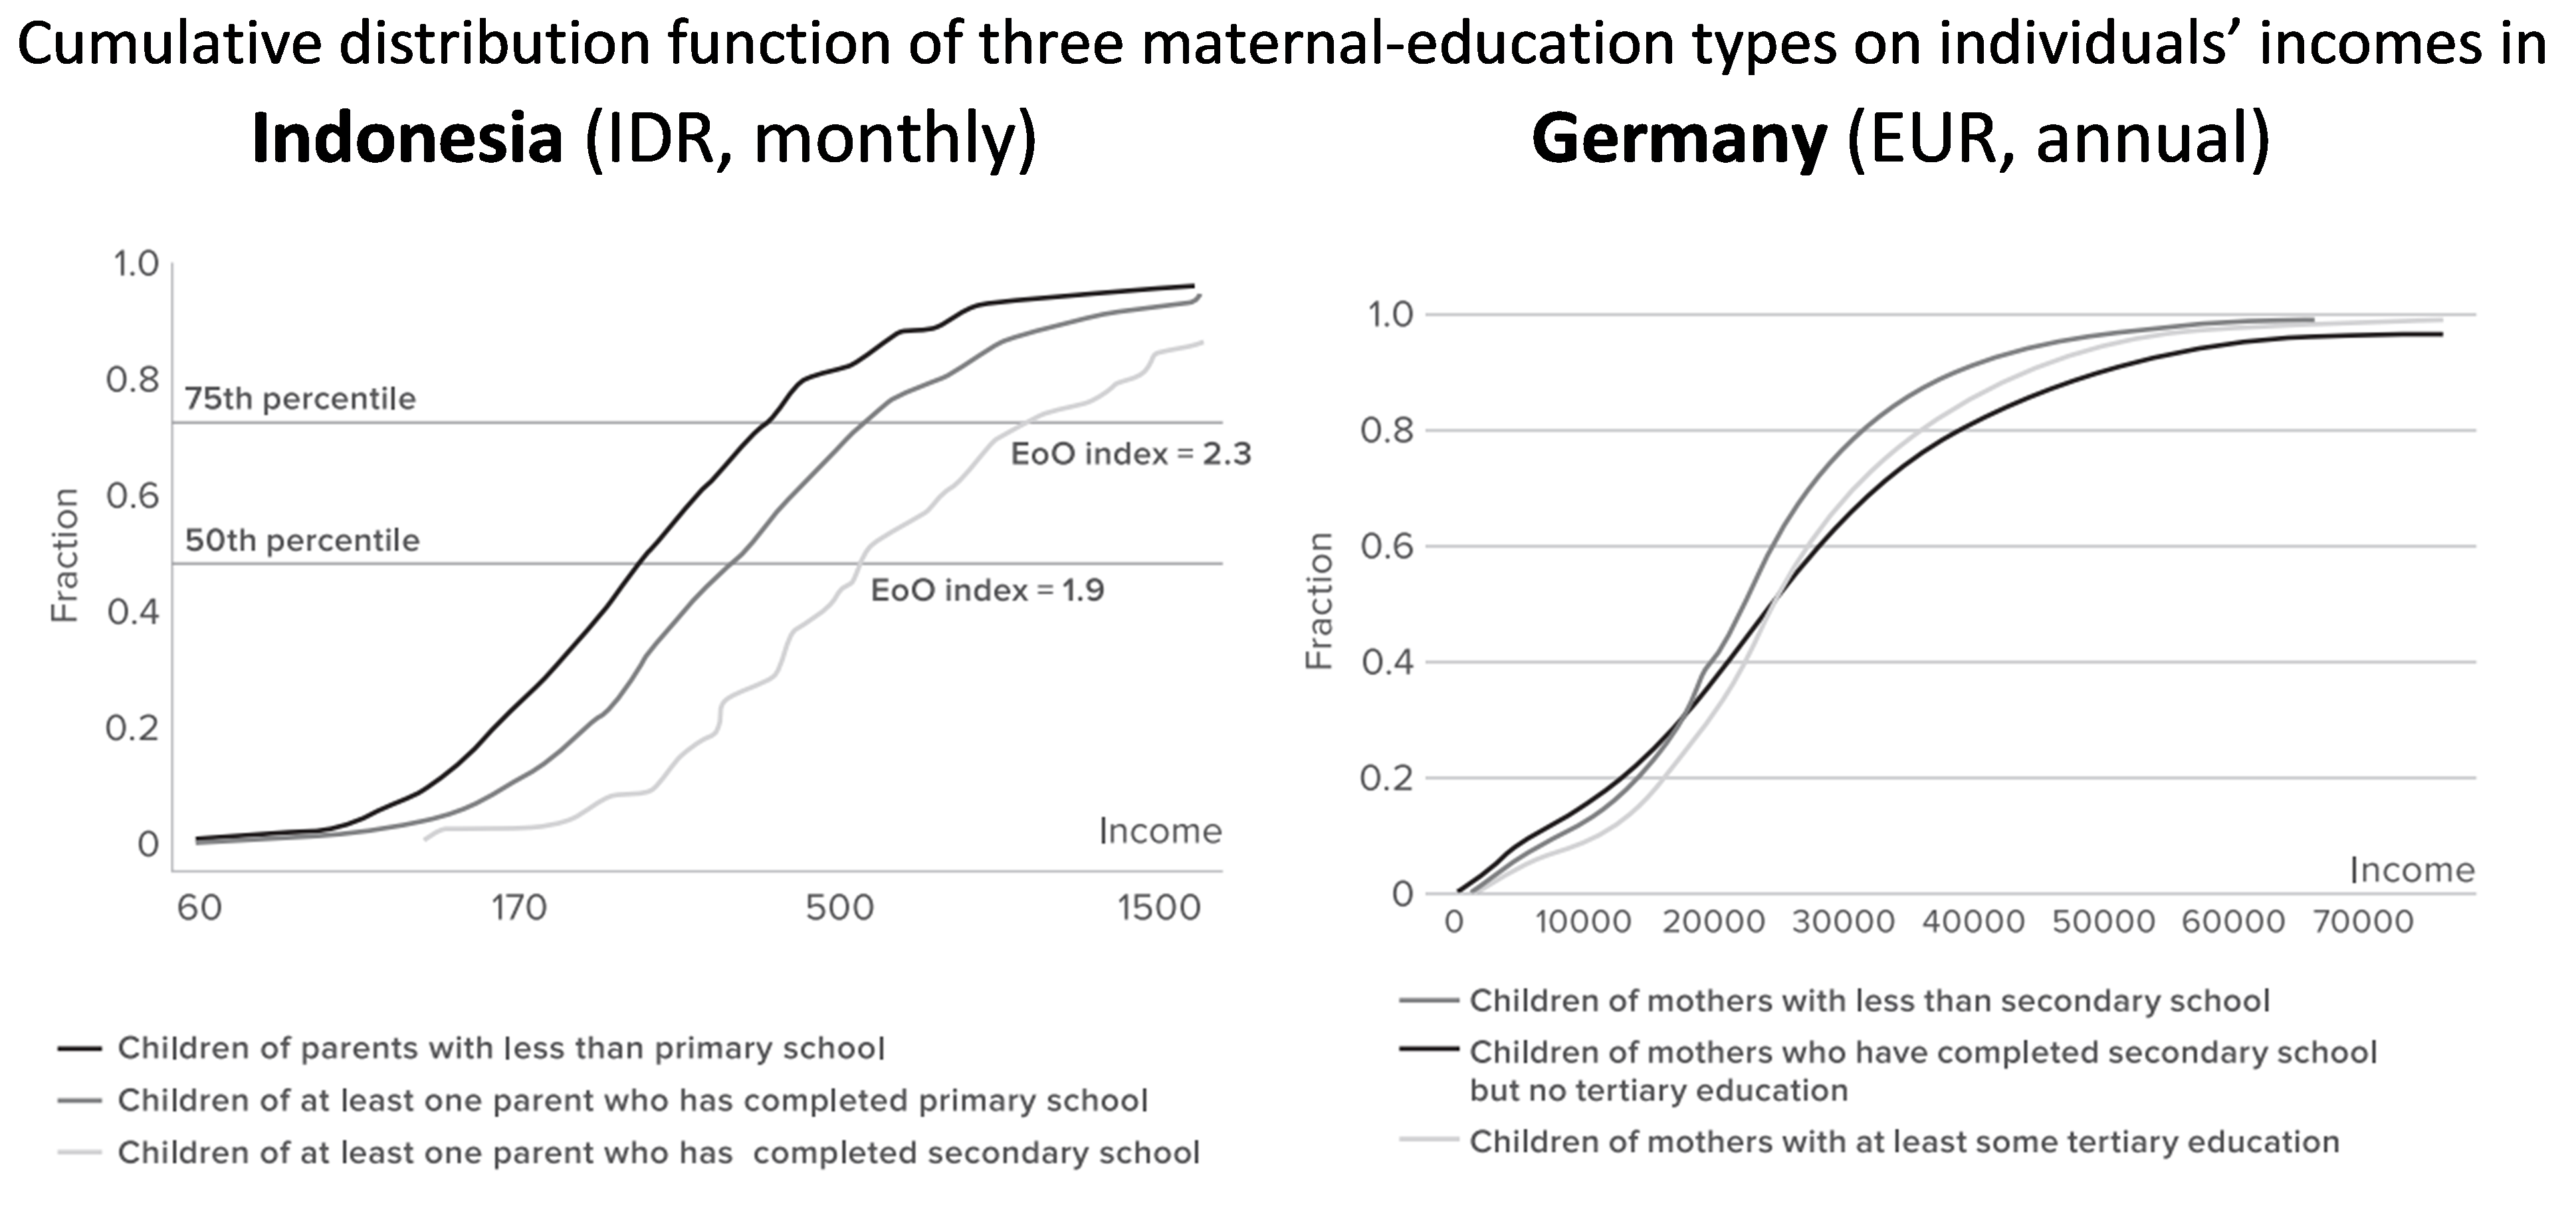
- To capture Human Inequalities, UNDP proposed the Inequality-adjusted Human Development Index (IHDI) back in 2010. The index takes into account not only the average achievements of a country on health, education and income, but also how those achievements are distributed among its population by “discounting” each dimension’s average value according to its level of inequality.
Finally, the World Bank offers a similar indicator, the Human Opportunities Index (HOI), which looks at how access to different opportunities—education, water, sanitation, etc—is distributed in a society. This could help us uncover how access to a particular right may be quite unequal across groups of children (urban boys vis-à-vis rural girls, for example).
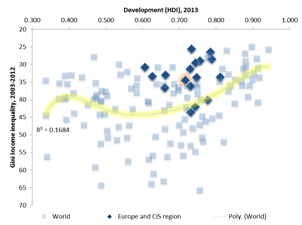
There is only weak connection between income inequalities and achieved level of development as measured by HDI…
|
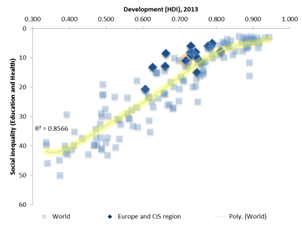 …but development and social inequalities are going together much more closer. …but development and social inequalities are going together much more closer. |
Bottom line
All models are wrong, but some are useful. It is time to move away from relying on the Gini coefficient – and towards more useful indicators of inequality to distinguish between the good, the bad and the ugly inequalities. More equitable world we all want should not end up as the kingdom of uravnilovka and suppressing people desire and ability to take part in development.
Join #TalkInequality conversation at Twitter. Have look on slides from presentation at “Dialogue on Inequality” meeting.