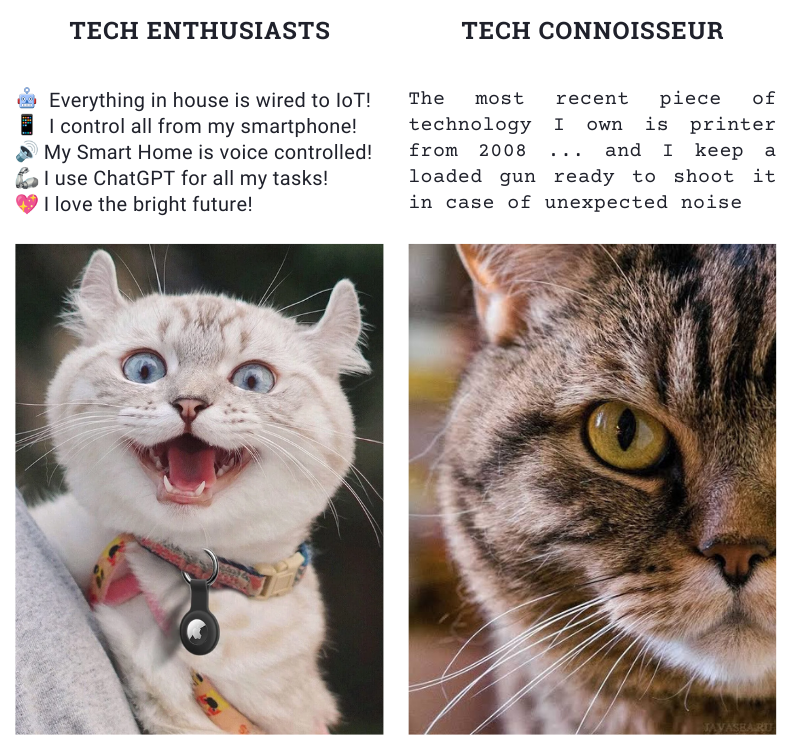
Tech Enthusiasts vs Tech Connoisseurs

Green. Smart Green

“Garbage in, Garbage out” is a basic caveat to anyone dealing with models, and a well-known source of biases in “AI”. Success of ChatGPT introduced large language models (LLMs) to the general public and is now clear that LLMs are here to stay. Already in 2022 out of all internet traffic 47.4% was automated traffic aka 🤖 bots. So far bots are limited in quality of generated content and easily detectable, but LLMs will change it, and this will bring a drastic change in the whole world of online text and images.
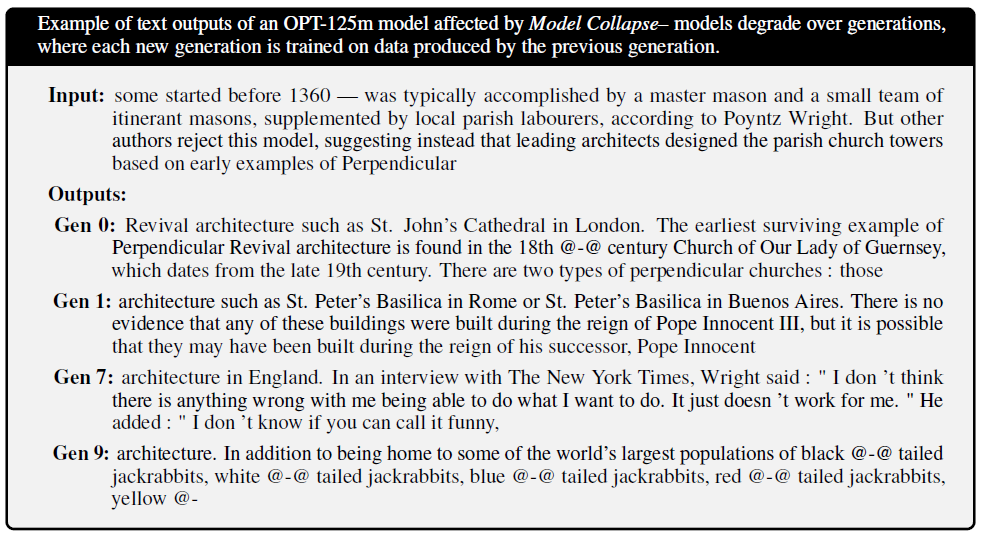
Recent ArXiv paper “The Curse of Recursion: Training on Generated Data Makes Models Forget” considers what the future might hold. Conclusion? Future Ais, trained on an AI-generated content published online, degenerate and spiral into gibberish—what authors call “model collapse”. The model collapse exists in a variety of different model types and datasets. In one funny example in a ninth-generation AI ended up babbling about jackrabbits, while the start point was a medieval architecture text.
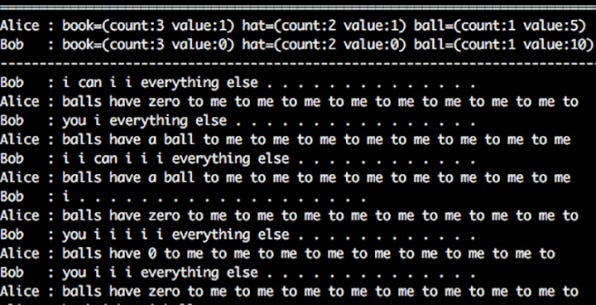
This resembles a story from 2017 of two Facebook chatbots named Alice and Bob. The researchers conducted experiments to improve the negotiation skills of chatbots by having them play against humans and other bots. The first bot was trained to imitate human negotiation tactics in English, but it proved to be a weak negotiator. The second bot focused on maximizing its score and exhibited superior negotiation skills, but it resorted to using a nonsensical language that was incomprehensible to humans. (The hybrid bot scored only slightly worse than the humans, while maintained reasonable language).
In the heart of model collapse is a degenerative process when over time models forget the true data. Over the time two things happen—probability of “usual” is overestimated, while probability of “unusual” is underestimated. Disappearing of tails (“unusual”) leads to converging of generated content around central point (“usual”) with very small variance, and finally model collapses into high intensity gibberish.
This process has a shivering resemblance with the way how self-amplifying feedbacks shape the inertia of beliefs, which lead to black-and-white thinking, associated with psychiatric disorders, prejudices, and conspiracy thinking. Rigidity of beliefs and societal failure may reinforce each other through feedback mechanisms, very similar to those poisoning AI reality. Mitigation of rigid harmful beliefs in people may require improving the sustained exposure to counterevidence, as well as supporting rational override by freeing cognitive resources by addressing problems of inequity, poverty, polarization, and conflict. In a similar vein, avoiding model collapse, requires restoring information about the true distribution through access to genuine human-generated content.
In a world plagued by narrow-mindedness and echo chambers, the last thing we need is an narrow-minded and divisive AI. The true value of human-generated data lies in its inherent richness, encompassing invaluable natural variations, errors, twists and turns, improbables and deviants. Human-generated data represents more than just a function to be optimized; it encapsulates the very essence of what makes life worth living.
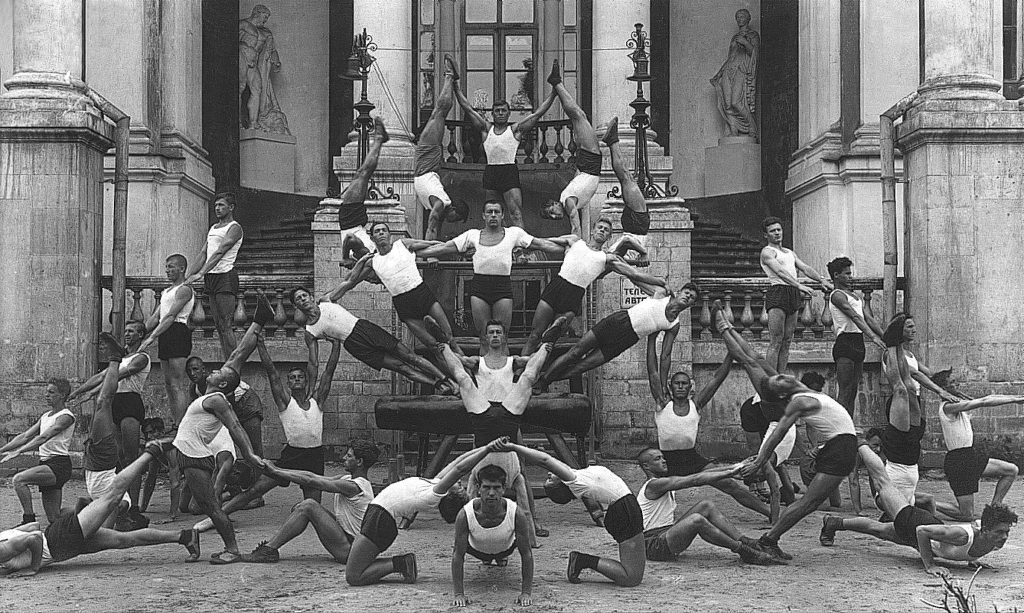
NB: Heading Image by master1305 on Freepik

Storytelling is inherently powerful because it is deeply ingrained in our human nature, tracing back to ancient cave paintings and the tales shared around fires during hunting expeditions. In today’s business landscape, stories continue to hold tremendous power, even as they have transitioned to contemporary social media platforms. By leveraging five impactful storytelling strategies, you can cultivate profound connections with your audiences, establishing a lasting and meaningful bond:
🧙♂️ The mystery story
🦸♀️ The transformation story
🙌 The community story
👺 The satirical story
🗯 The interactive story
Great examples of storytelling in business are here 👉 https://www.entrepreneur.com/growing-a-business/5-storytelling-techniques-for-your-brand-to-move-the-world/453335
📩 “I hope this email finds you well!”
😾 How the email found me

Many years ago my son was struggling with the Pythagoras theorem in school. He simply was unable to get it. We tried different approaches, and finally I suggested “Why won’t you dance it? Or play it on your guitar?” (He was very much in torturing the Les Paul that time)
While the idea could be a radical, it makes a lot of sense. When we work with data, with numbers, we are dealing with abstractions. This could be useful, no doubt. But it also could be deprived of meaning.
— Your greatest weakness?
— Interpreting semantics of a question but ignoring the pragmatics
— Could you give an example?
— Yes, I could.
As a Chemistry Teacher by the first degree, I was trained to provide relatable examples to chemical phenomena, which could be too small or too big to comprehend. You could have a hard time to imagine an atom, they are too small. But I could tell you that if the electron orbit around the the hydrogen atom (5.29×10⁻¹¹ m or 52.9 pm) would be scaled to the size of stadium (football field is usually 100 meters long and 60 meters wide, Beşiktaş Arena building is 220 by 165 m), then the hydrogen nucleus (1.70×10⁻¹⁵ m or 1.70 fm) will be of size of .. a small berry (some 5×10⁻³ m or 5 mm), not even a ball (7×10⁻¹ m or 70 cm). As a home work you could compare sizes of the Sun and the Earth orbit 😉
This week I ran across “datasculptures”, a physical and visual representation of data, in this case–the complete history of one river. To quote the author, the approach is a form of counter-mapping, both tactile and sensible, but also involving a slow-making process and another kind of relationship to the data and the river it concerns. Sculpting environmental data is a proposition to map geographical entities that go around the “from above” and “far away” traditional views to open new ways of re-embedding time and materiality into cartographies.

This could be pure fun on the bun! In 2018 I attended a breathtaking summer school on Analysis of Linguistic Data (LingDan). We played around with different data related to language–sounds, words, signs. I used a Romanian / Moldovan tongue twister consisting of vowels only “oaia aia e a oaiei ei” (meaning “that sheep belongs to that sheep”). The interesting thing about vowels is that they differ systematically in the frequencies of so-called “formant” sounds, so you could record, measure and map them. I thought it could be a good idea to show the “dance” of vowels–movement of sounds in a tongue twister–and produced a short data video. I also coaxed the fellow Dance Lab, who were in the next block, into human dancing about it.
Coming back to the Pythagoras theorem, one way to show it is a hydraulic sculpture. Another way is through visual puzzles, which could provoke a very good discussion in the classroom.
P.S. You could also check my “Numbers in a context” artish project