The Rise of the Data Elite: How AI Research is Re: inforcing Power Imbalances

The rise of AI-powered tools is transforming our everyday lives. We use the magic of ChatGPT and Midjourney and more mundane AI-powered credit profiling and email completion tools. However, the democratization of AI use is accompanied by global power disparities in AI research. A chart from the “Internet Health Report 2022” shows that the landscape of AI research papers is heavily skewed towards a few countries and elite institutions. The map reveals that more than half of the datasets used for AI performance benchmarking were from just 12 institutions and tech companies in the United States, Germany, and Hong Kong (China).
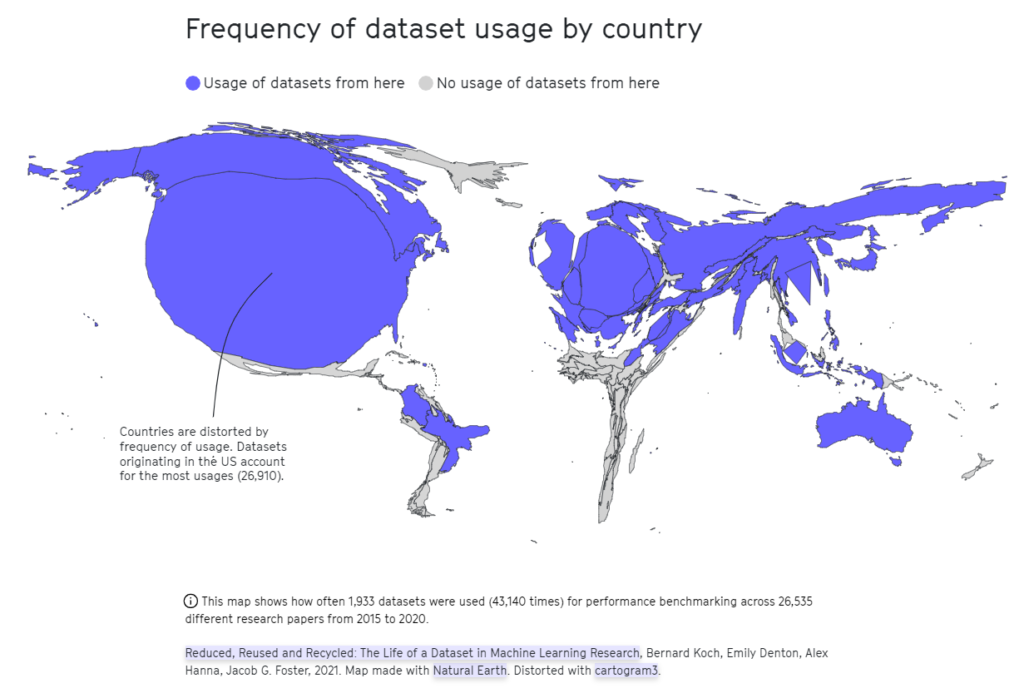
This map shows how often 1,933 datasets were used (43,140 times) for performance benchmarking across 26,535 different research papers from 2015 to 2020.
Reduced, Reused and Recycled: The Life of a Dataset in Machine Learning Research, Bernard Koch, Emily Denton, Alex Hanna, Jacob G. Foster, 2021.

This major imbalance in the discourse about how AI should be used and who should benefit from it reinforces existing power imbalances. A discussion piece from Data Pop Alliance called “The Return of East India Companies: AI, Africa and the New (Digital) Colonialism” explores various aspects of AI colonialism in Africa. For instance, there is under-development of natural language processing (NLP) technologies for non-Western languages. Computer vision of self-driving cars relies on low-paid human workers to label hundreds of hours of data. Lax ethical standards and “data dumping” in countries with less stringent data protection regulations effectively renders local people and society—AI guinea pigs. Despite the decreasing cost of training machine learning systems and greater availability of data, the power dynamics in AI research and development continue to reflect the dominance of a select few.

While machine learning models and datasets are being developed in other parts of the world, their use in research papers and performance benchmarking is still limited. We have the power to seek greater diversity and inclusivity in AI research, and to advocate for ethical standards that address data inequalities–as consumers and as researchers. For example, the UNDP and UNICEF regional Eurasia platform STEM4ALL to promote women and girls, share knowledge, raise awareness, and break gender stereotypes in STEM. Another way is by promoting collaboration across borders and develop own datasets to contribute to the global conversation.

Birthday Opportunity: Natural experiment in Cash Transfers Investing in Infants

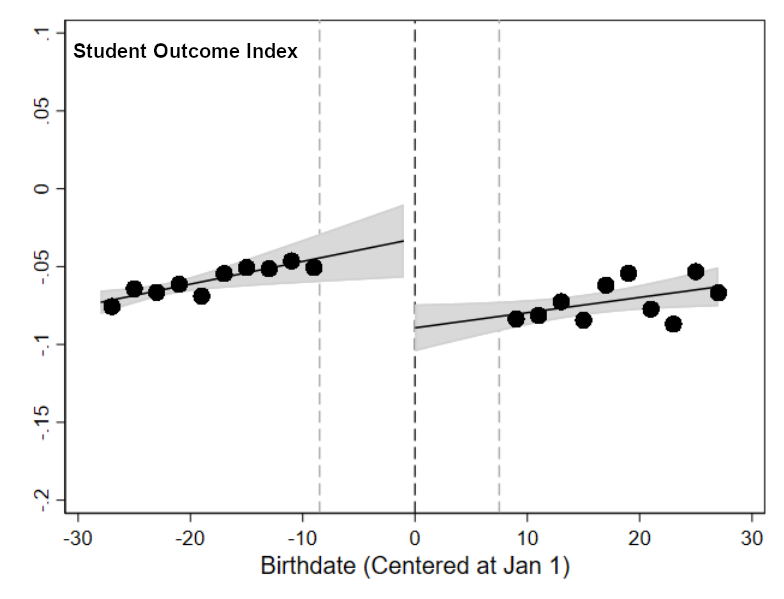
Cash transfers following the birth of a first child can have large and long-lasting effects on that child’s outcomes. Andrew C. Barr and two co-authors made use of natural experiment—the January 1 birthdate cut-off for U.S. child-related tax benefits. Children born in December of previous year are eligible for tax deduction, while children born just a couple of weeks later, in January, are not eligible. As a result, families with otherwise similar children receiving substantially different refunds during the first year of life—roughly $1,300, or 10 percent of income for the average low-income single-child.

Using the careful data connection strategy, authors showed that this transfer in infancy increases young adult earnings by at least 1 to 2 percent, with larger effects for males. Baseline estimates indicate that eligibility for additional resources during the first year of life generates a $319 increase in average annual earnings between age 23 and 25 and a $456 increase between ages 26 and 28. These effects persist to older ages, with 2-3 percent increases at ages 29-31 and 32-34. These estimated effects are larger than those generated by the in-kind support programs. According to calculations, additional tax receipts associated with the increased earnings in adulthood, exceed the amount of the initial transfer, implying a negative net cost to the federal government.

The observed earnings effects appear to be explained by earlier human capital effects. the North Carolina education data showed substantial increases in test scores, reductions in behavioural problems, and a greater likelihood of high school graduation during childhood and adolescence. This chart shows effect of cash transfer eligibility on student outcome index, constructed as the mean of normalized test scores in grade 3-8, high school graduation, and any suspension in middle or high school. Birthdates to the left of the dotted line represent those where the child’s family could have received additional resources from child-related tax benefits in the following year (if eligible based on income).

Andrew C. Barr, Jonathan Eggleston, and Alexander A. Smith (2022) “Investing in Infants: The Lasting Effects of Cash Transfers to New Families”. NBER Working Paper No. 30373, August 2022. http://www.nber.org/papers/w30373

Shades of Informality

Informal employment attracts a lot of attention, because it is widespread but associated with risks. It lacks of insurance against shocks, and therefore directly related to vulnerability to poverty. Many Social-Economic Impact Assessments of COVID-19 showed that informal workers were particularly hit hard by turbulence in 2020-21. However, measurement of informality is not that simple. Most often used definition is lack of social and/or health insurance. Meanwhile, research has shown that formalization does not automatically lead to poverty reduction.

While there are many reasons why this link does not work automatically—flexibility of informal arrangements, hidden costs of formalization—one reason could be how we measure informality. We usually measure welfare on the family level, using household income or expenditure and assuming that families share these. However, informality is usually measured and analysed on individual level—individual workers, family firm, the household head—without making assumptions how risks and benefits of informality are shared in family. (There is a rich and growing body of literature on migration as a risk sharing, for instance “Risk Sharing and Internal Migration”) As a result, policies related to poverty reduction and reducing the risks of informality are often designed with different groups in mind—families and single individuals respectively.

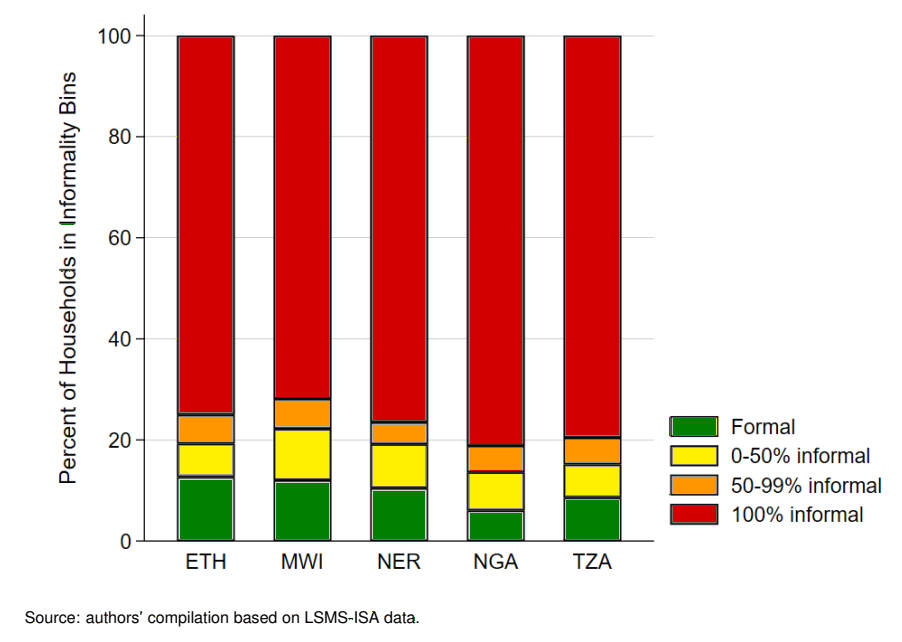
This chart of the week comes from a recent paper “Welfare and the depth of informality. Evidence from five African countries”. It shows that there are shades of “informality”, rather than simply “Yes” / “No” dichotomy. The paper further investigates the relationship between welfare and informality at the household level. The findings confirm the nonlinear relationship between welfare and informality—families with some formal incomes are as well off as families with only formal income. Moreover, paper suggests that moving to full formality only translates to meaningful welfare improvements if the household income gain is sufficiently large.

Gimble in the Wabe

Recent developments in AI resulted in impressive tools, like a model for image generation. For instance, DALL-E 2 grabbed many headlines, as it can create realistic images and art from a description in natural language. While the generated images are impressive, basic questions remains unanswered—how does the model grasp relations between objects and agents? Relations are fundamental for human reasoning and cognition. Hence, machine models that aim to human-level perception and reasoning should have the ability to recognize relations and adequately reflect them in generative models.

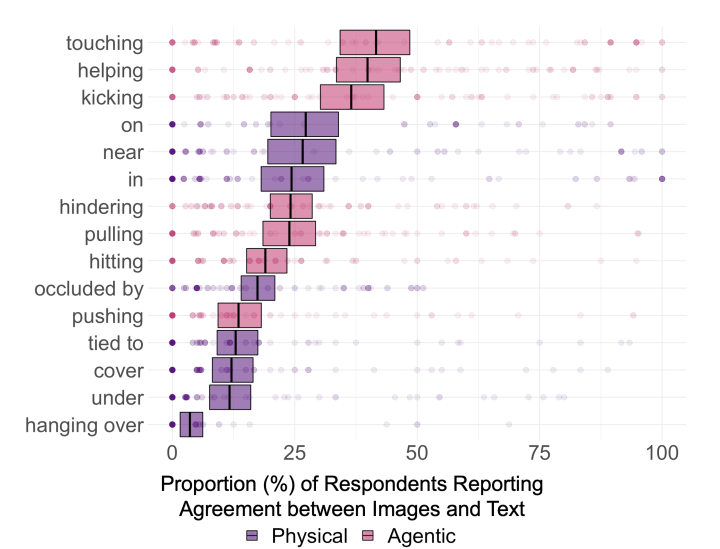
Recent paper “Testing Relational Understanding in Text-Guided Image Generation” puts this assumption in test. The researchers generated galleries of DALL-E 2 images, using sentences with basic relationships—e.g. “a child touching a bowl” or “a cup on a spoon”. Then they showed images and prompt sentences to 169 participants and asked them to select images that match prompt. Only some 20% of images were perceived to be relevant to their associated prompts, across the 75 distinct prompts. Agentic prompts (somebody is doing something) generated slightly higher agreement, 28%. Physical prompts (X position in relation to Y) showed even lower agreement, 16%. The chart shows the proportion of participants reporting agreement between image and prompt, by the specific relation being tested. Only 3 relations entail agreement significantly above 25% (“touching”, “helping”, and “kicking”), and no relations entail agreement above 50%.

The results suggest that the model do not yet have a grasp of even basic relations involving simple objects and agents. Second, model has a special difficulty with imagination, i.e. ability to combine elements previously not combined in training datasets. For instance, the prompt “a child touching a bowl” generate images with high agreement (87%), while “a monkey touching an iguana” show worse results (11%). “A spoon in a cup” is easily generated, but not “a cup on a spoon”, reflecting effects of training data on model success.

Breaking the loop of black-and-white thinking

Beliefs are a building blocks of society and economy, thanks to their advantage of guiding consistent behaviour and judgments. Yet beliefs need revisions to be a key element of healthy cognition. “When the facts change, I change my mind. What do you do, sir?”, Keynes reportedly answered to an accusation of being inconsistent. Overly rigid beliefs are the basis of many destructive issues for individuals, nature, and society problems—prejudices, discrimination, conspiracy theories, psychiatric disorders. In principle, provision of counterevidence can destabilize rigid beliefs and lead to their revisions. But numerous experiences suggest that this is not that simple. Rigid beliefs show remarkable inertia and require cognitive resource for rational response, often not available.

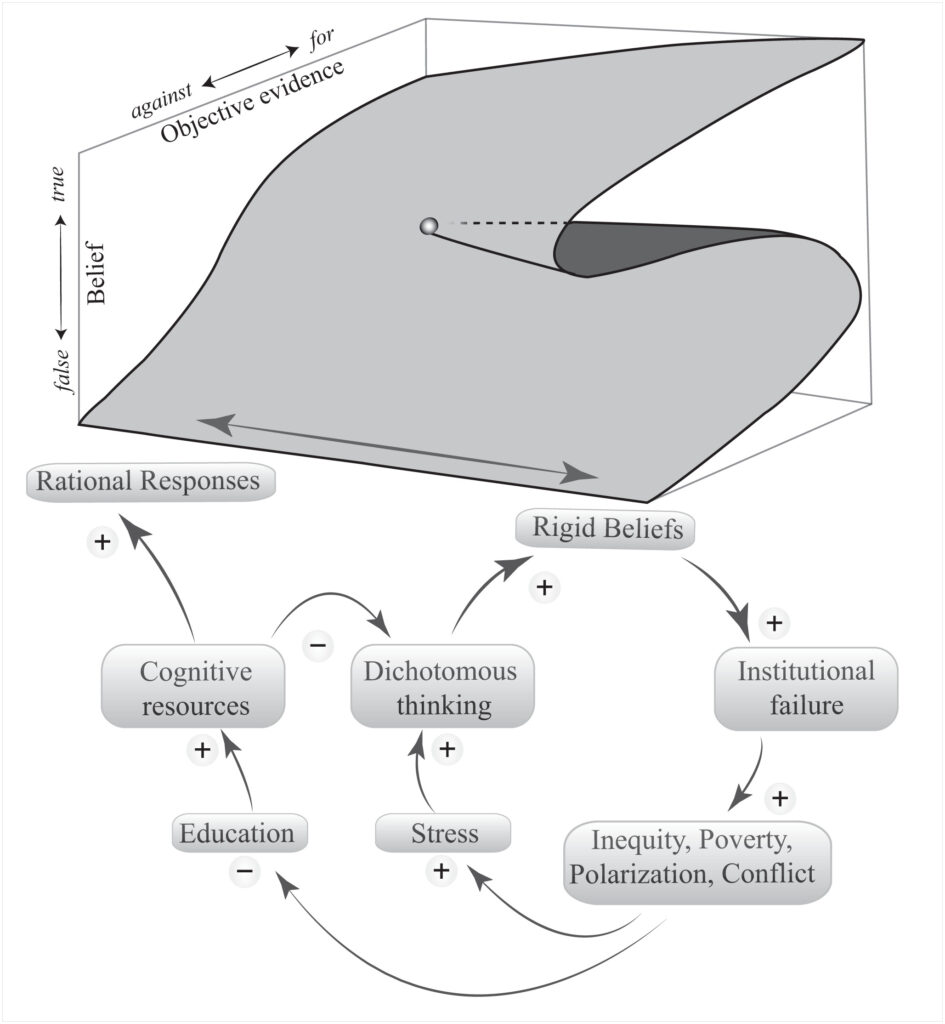
The paper “Belief traps: Tackling the inertia of harmful beliefs” provides explanation of this inertia using recent findings from neurobiology, psychiatry, and social sciences. The paper presents a unifying framework of how self-amplifying feedbacks shape the inertia of beliefs on levels ranging from neuronal networks to social systems. The chart summarizes it and shows how resilience of beliefs is boosted by stressful conditions.

Black-and-white thinking is a major risk factor for the formation of resilient beliefs. Lack of cognitive resources contributes to this dichotomous thinking. Stress could also exacerbate it. No surprise that conspiracy thinking and psychiatric disorders tend to peak during crises. On an individual level, false beliefs may lead to unwise decisions. On a societal level, unfounded beliefs could lead to behaviour with enormous costs for society and nature—beliefs in conspiracy theories may hamper the functioning of institutions; beliefs about intrinsic capacities related to groups (gender, race) perpetuate discrimination, entrench inequalities, result in underutilization of human potential; belief that some parts of animals—rhinoceros horn, shark fin—works as a medicine drive species extinct. Resulting inequality, poverty and lack of education could further promote stress and lack of cognitive resources, a driving factors of black-and-white thinking, thus closing the loop.

The paper suggests the most effective way to counteract this vicious cycle may be measures reducing social stress. Addressing social factors such as poverty, social cleavage, and lack of education could prevent the emergence of rigid beliefs. Finland national basic income experiment reported positive effects on the sense of well-being of recipients and feelings of trust in other people and the government. Most recent UNDP Human Security Report puts agency at the core of an expanded human security framework, reminding that wellbeing achievements alone are not enough, and help avoid the pitfalls of partial solutions, such as delivering protection with no attention to disempowerment or committing to solidarity while leaving some lacking protection.

Patterns and Drivers of Health Spending Efficiency

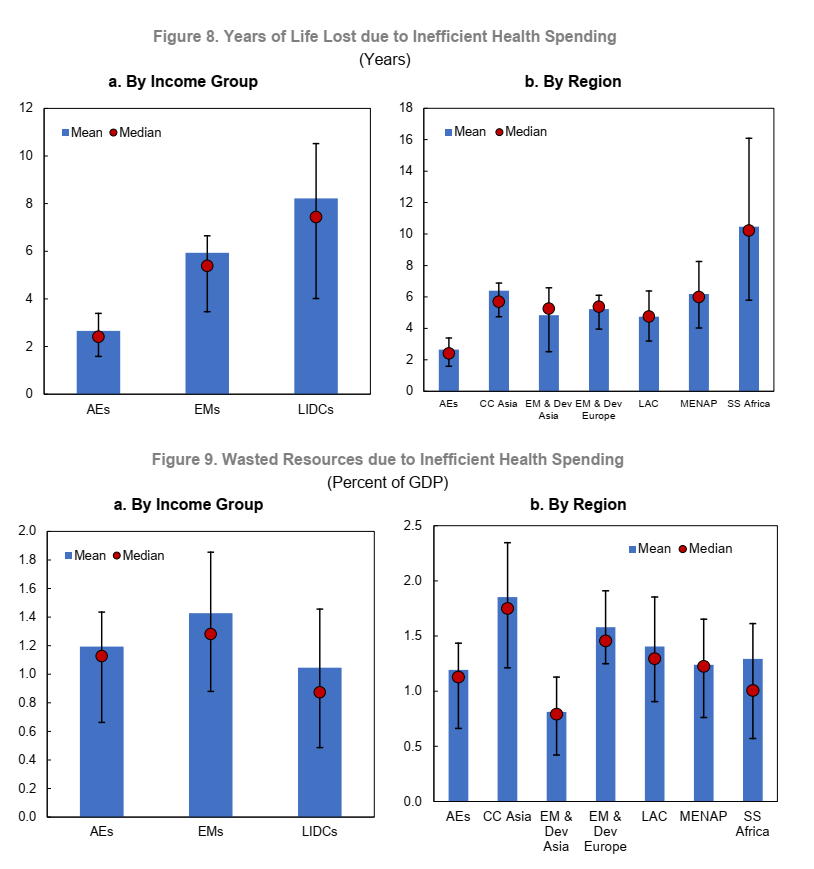
Health issues are high on public policy agenda. Health-related Sustainable Development Goals are yet to be achieved, COVID-19 pandemic is still on, and ageing population requires additional health services. Demands for health expenditures are at an all-time high all across the globe, while the fiscal space is limited. Not surprising, policymakers focus attention on ensuring that resources are used efficiently. This chart of the week shows losses—in terms of years of life and percent of GDP—due to health spending inefficiencies. It comes from the recent IMF Working Paper “Patterns and Drivers of Health Spending Efficiency”, which considers input- and output-oriented measures of (in)efficiency, depending on country distance from the frontier of expenditures-life expectancy.

The paper explores other patterns in efficiency across income groups, regions, and time, and the fiscal and years-of-life losses due to how health resources are spent. It goes further in exploring the question of drivers of health expenditure inefficiency, focusing on three major drivers: universal health coverage with essential services, income distribution, and corruption.

Universal health coverage is a crucial driver of health efficiency. If each country were to achieve, for each policy variable, the 75th percentile of its income group, low-income developing countries (LIDCs) would on average benefit from an increase of 3.4 years of life, while emerging markets (EMs) would gain 2.2 life years. Measured in expenditures savings, EMs and LIDCs to benefit from 0.39 and 0.37 percent of GDP. A more equitable distribution of income brings lower but still substantial gains in life expectancy by 1.7 and 2.1 years for EMs and LIDCs, respectively—or bring in savings of 0.17 and 0.12 percent of GDP. Better control of corruption is important, especially for EMs, which can benefit from an additional 1.6 years of life expectancy or avoid the waste of 0.27 percent of GDP in health spending. LIDCs gain 0.7 years of life expectancy or save 0.1 percent of GDP.

The Economics of Fertility: A New Era

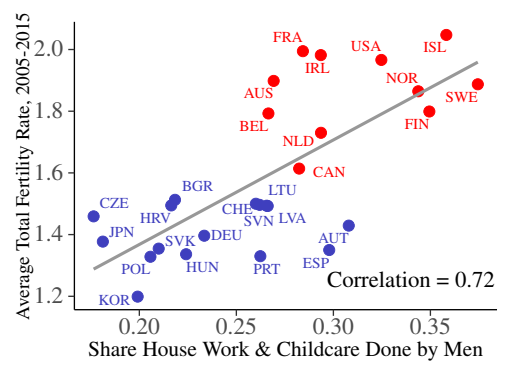
Poor families (and countries) tend to have more children. Women have to choose between work and children. These two empirical regularities have held for quite long. The economics of fertility has entered a new era because these stylized facts no longer universally hold—according to a recent IZA working paper “The Economics of Fertility: A New Era”.

The chart of the week shows one of the underlying factors—sharing household burden. The sample of OECD countries shows strong positive correlation between fair sharing of household work and total fertility rate.

According to the research, in high-income countries, the income-fertility relationship has flattened and—in some cases—reversed. The cross-country relationship between women’s labour force participation and fertility is now positive.

There is a number of new theories, explaining the compatibility of women’s career and family goals—a key driver of fertility. Four common factors facilitate combining a career with a family: (i) family policy; (ii) cooperative fathers; (iii) favourable social norms; and (iv) flexible labour markets.

These things don’t come automatically, investments in social care could make difference. Time poverty could hold back women labour market participation, even if other factors are favourable. Researchers suggest that public investment in the social care services sector have a significant multiplicative effect and create jobs in other sectors. The new economics of fertility hints that now there is no inevitable trade-off between women empowerment and fertility.

Upside down map?

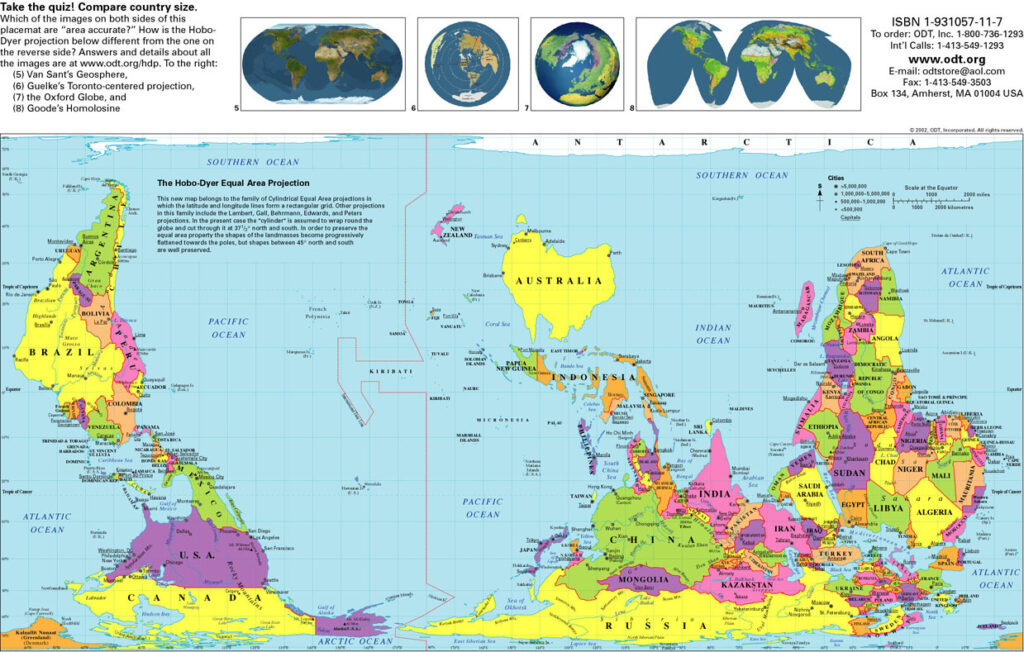
This chart of the week shows map of the World as seen from Australia, in Hobo-Dyer projection. Quite unfamiliar view, if you live in Europe—like I do—and are accustomed to Europe-centered, North on the top, Mercator projection maps.

Any map is a model of reality, imperfect representation of things, based on a set of assumptions and conventions. Mercator projection is very useful for certain purposes and it was invented for them. It is preserving angles, and thus local directions and shapes, making it indispensable for navigation. North on the top, South on the bottom is a useful convention. However, it comes with a cost—it inflates the size of objects away from the equator. Russia, Canada, and especially Greenland and Antarctica look much bigger than they are. XCKD jokingly proposed a Madagascator projection, which designed solely to exaggerate size of Madagascar through using unorthodox specifications of projection).

We keep similar mental maps for many things and navigate them so routinely, that we take assumptions and conventions for granted. Navigating complex issues requires comparing and aligning our mental maps. Such a comparison could help us to see the issue on various maps and find a joint way forward.

Maping ecosystem services contribution to SDGs for Small Island Developing States

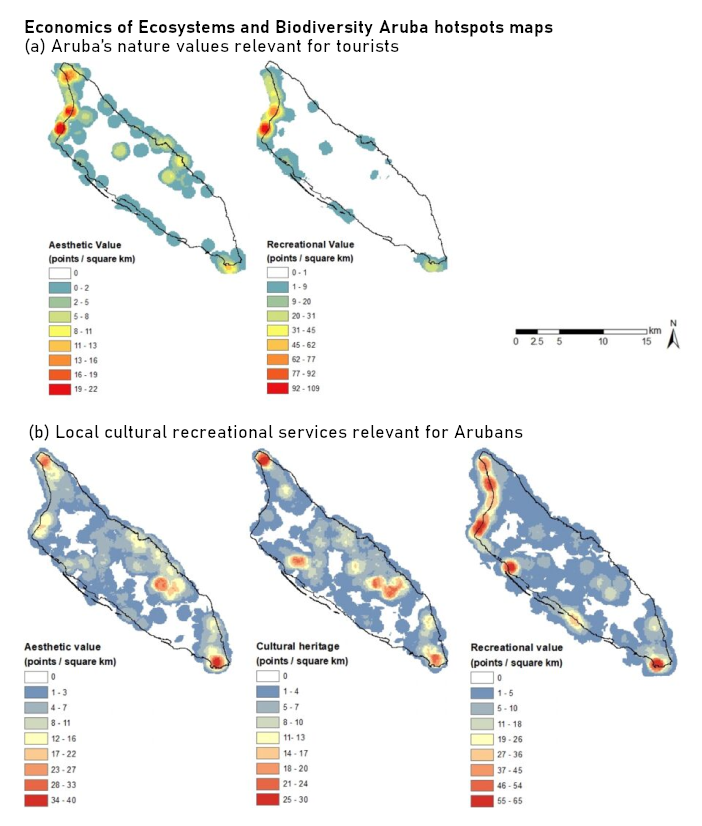
Marine and coastal ecosystem services play cruicial role in the economy and well-being in Small Island Developing States. These services could contribute to common challenges in achieving the Sustainable Development Goals. Fact-based solutions, based on linking ESS and SDGs, are essential for nature conservation and sustainable development in SIDS. The recent study developed an approach to capture the contribution of ESS to the achievement of SDGs in Aruba.

The study quantitatively capture the contribution of three ESS to the achievement of priority SDG targets, as well as interlinkages between priority SDG targets. Lack of data for many of the ESS is an issue widely by local stakeholders in Aruba. A shortlist of indicators provided appropriate metrics of the socio-economic value of fisheries and socioeconomic data on nature-based tourism. This chart, a hotspots maps provides information on how Arubans perceive the importance of nature for cultural and recreational activities and their well-being.

#SIDS #ESS #ecosystemservices #SDGs #SDG14 #chartoftheweek #Aruba