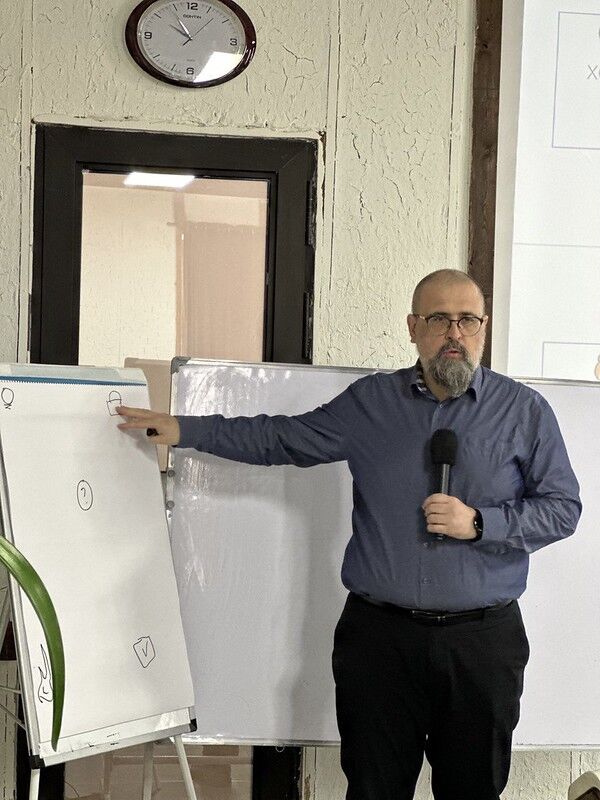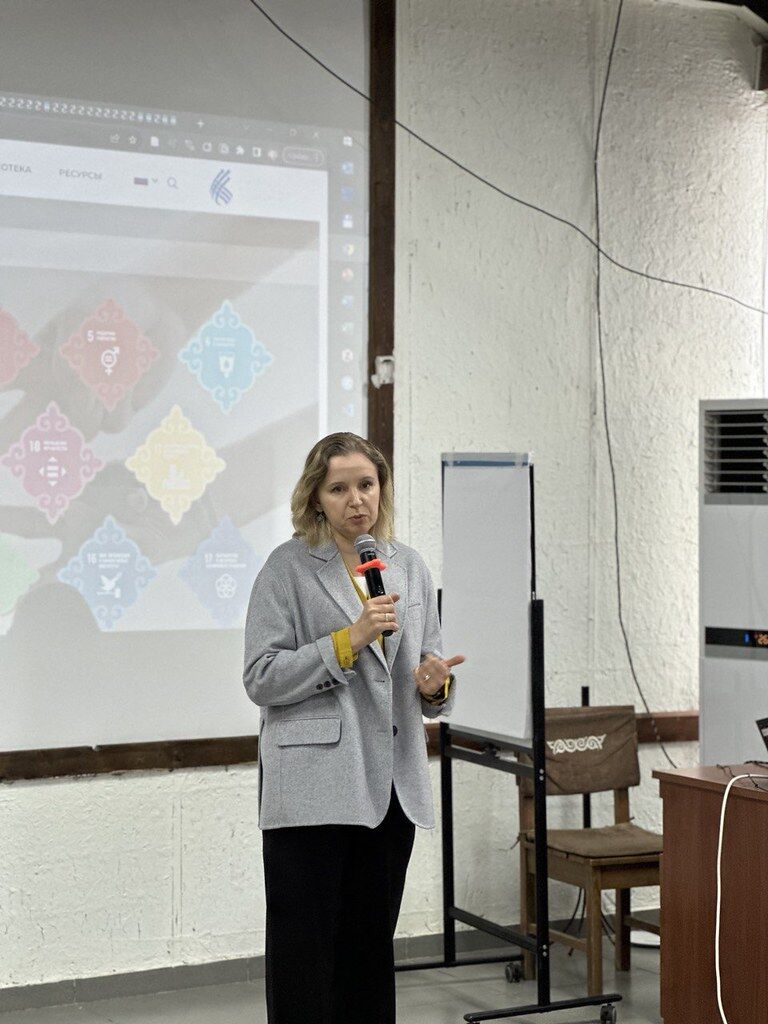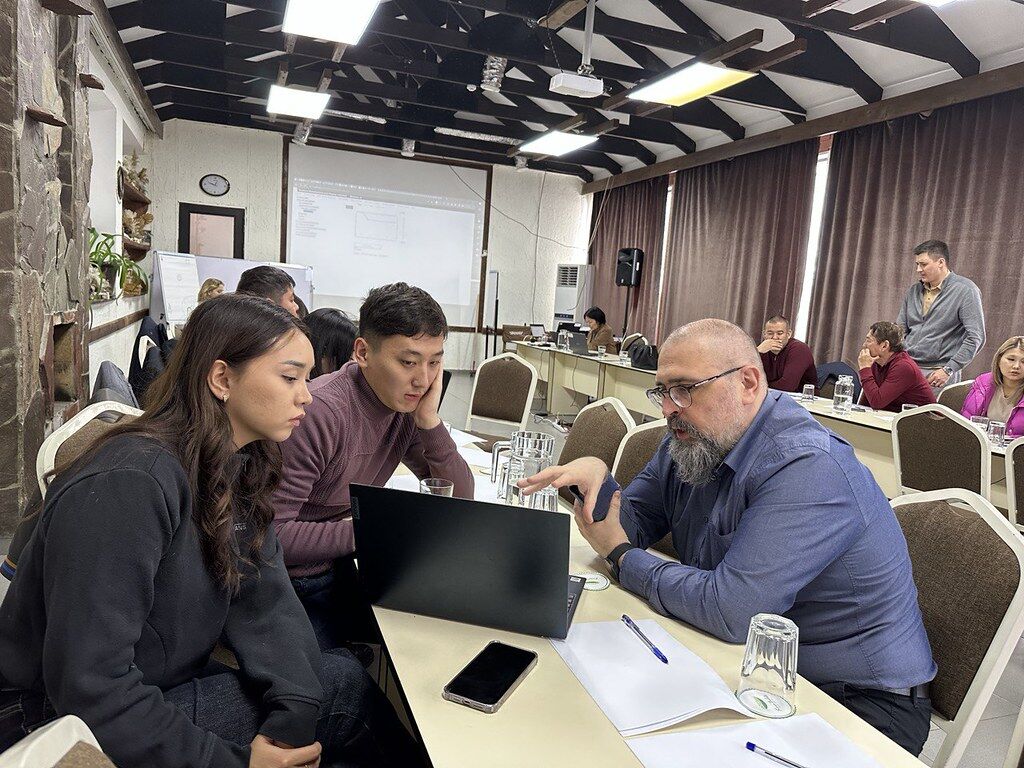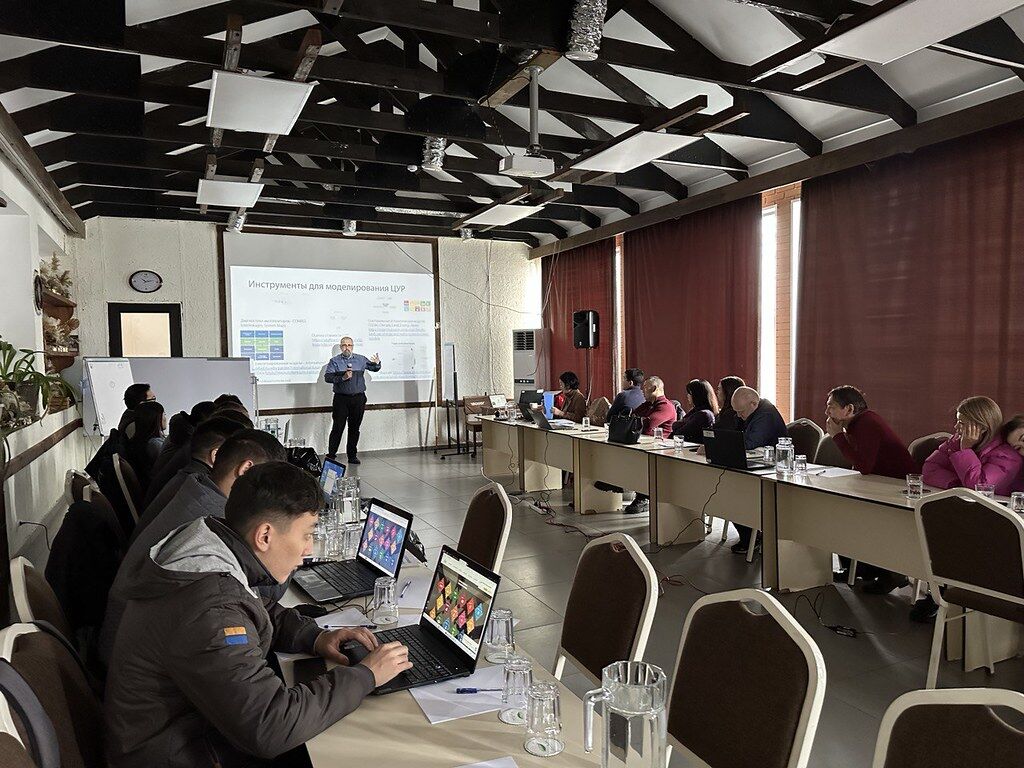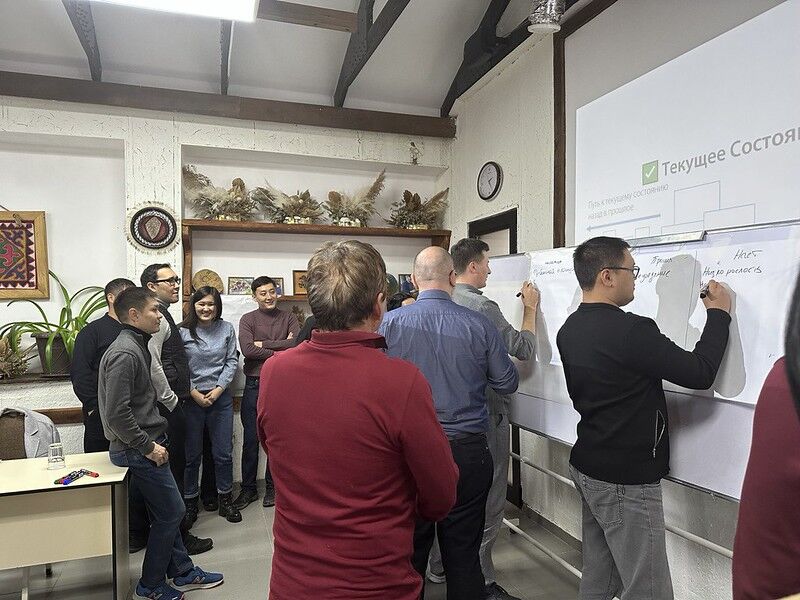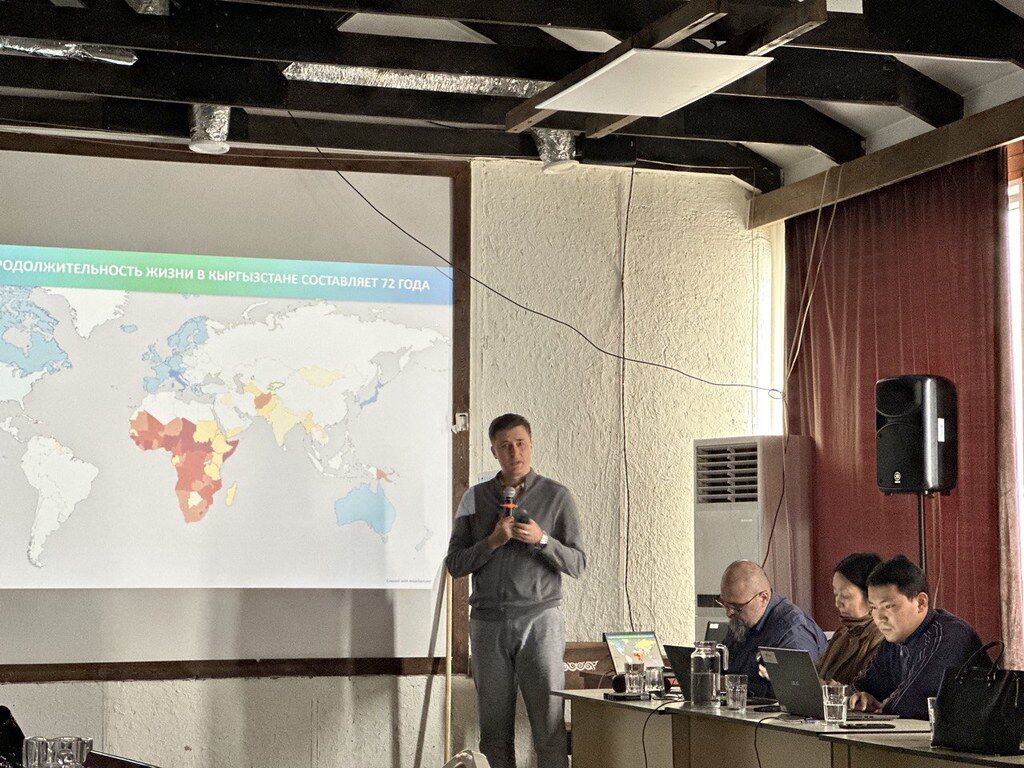
Had a great pleasure to facilitate the “Modelling for the SDGs” workshop organized by UNDP Kyrgyzstan this Saturday, 14 October 2023, a vital step in the collective journey to achieve the Sustainable Development Goals in Kyrgyzstan and CentralAsia. We combined different tools to explore possible futures.
We are using the International Futures Model by Frederick S. Pardee Center for International Futures for trends projections.
We also explored an IMPOSSIBLY good and bad futures, Utopia and Dystopia–Kyrgyzstan being the first to send people on Mars; and country fully depopulated by the Martian Plague. For this exploration we used Future Backwards method by The Cynefin Company (formerly Cognitive Edge)
It was great to see how tools help unlocking the deep discussion and spot the turning points in the journey to future(s)
Tag Archives: storytelling
Five Storytelling Techniques
Storytelling is inherently powerful because it is deeply ingrained in our human nature, tracing back to ancient cave paintings and the tales shared around fires during hunting expeditions. In today’s business landscape, stories continue to hold tremendous power, even as they have transitioned to contemporary social media platforms. By leveraging five impactful storytelling strategies, you can cultivate profound connections with your audiences, establishing a lasting and meaningful bond:
🧙♂️ The mystery story
🦸♀️ The transformation story
🙌 The community story
👺 The satirical story
🗯 The interactive story
Great examples of storytelling in business are here 👉 https://www.entrepreneur.com/growing-a-business/5-storytelling-techniques-for-your-brand-to-move-the-world/453335
The Storycraft Adventures: Mapping Way Ahead with Fibonacci and Dragons
The Storycraft Adventures: Mapping Way Ahead with Fibonacci and Dragons Can stories be the driving force behind change and guide us towards a clear path forward? This question was at the heart of my recent workshop with the European Trainers Network. Our goal was to explore the potential of storytelling in finding solutions for pressing challenges, such as improving internal communication and achieving results with diverse teams. Using a guinea pig of a fictional scenario crafted from three real stories, we embarked on a three-step journey. We delved into telling the stories, leveraging the power of Anecdote Circles, mapped possible solutions in the complexity space using the Cynefin framework, and employed the technique of Planning Poker to prioritize our solutions.
Playing Planning Poker turned out to an immensely insightful exercise. For those who are not familiar with the Planning Poker—it is a gamified technique for estimations. The members of the group make estimates by playing numbered cards face-down to the table, instead of speaking to them aloud, to avoid the cognitive bias of anchoring. A typical deck has cards showing progressing in non-linear manner (e.g. 0, 1, 2, 3, 5, 8, 13, 20, 40, 100), as it better reflects the nature of the world. We played in Zoom White Board using a shortened deck by Redbooth—only 1, 3, 8, 100 and Dragon “Here be dragons” to mark dangerous unknown areas.
Our participants were tasked with estimating the level of effort required for the proposed solutions that we had mapped in the previous step. After the initial round of assessments, a fascinating picture emerged. Some ideas received similar estimates, while others, including seemingly straightforward solutions, garnered disparate cards—like a combo of 1, 100, and the enigmatic Dragon. Rather than seeking immediate consensus and convergence, we embraced the divergence and initiated conversations. This exploration uncovered a wealth of stories and nuanced solutions. For instance, the idea of having a dedicated communicator to facilitate dialogue between different teams was split into two parts. The first part, selecting a dedicated person to facilitate communication, received a score of 3 and was placed in the complicated domain—there are good practices how to do it. However, organizing the communication process itself, was considered a project itself, requiring expert knowledge and scored 100, and placed between complex and complicated dolmans—as it requires experimentation. Similarly, a seemingly simple idea to partner with an electronic company to provide travel adaptors for the US market was met with a dissenting Dragon card. This unexpected response raised important considerations related to legal requirements and the need to thoroughly assess market demands before proceeding.
The Storycraft Adventures workshop helped me to realize three things. First, stories has an immense transformative potential. Second, estimations, similar to Planning Poker, could highlight important deviations in views and dissents—promising unexplored territories and a fresh perspective. Third, in embracing the divergence and exploring the stories behind the different estimates, we uncovered a treasure chest of insights and valuable perspectives. By combining storytelling techniques with collaborative estimation methods, we gained a deeper understanding of the challenges at hand and charted a way forward that encompassed the complexity and nuances of our goals.
European Trainers Network is serving club members of any Toastmasters club in Europe. ETN facilitates development of skills needed to create and conduct training sessions using adult learning theory.
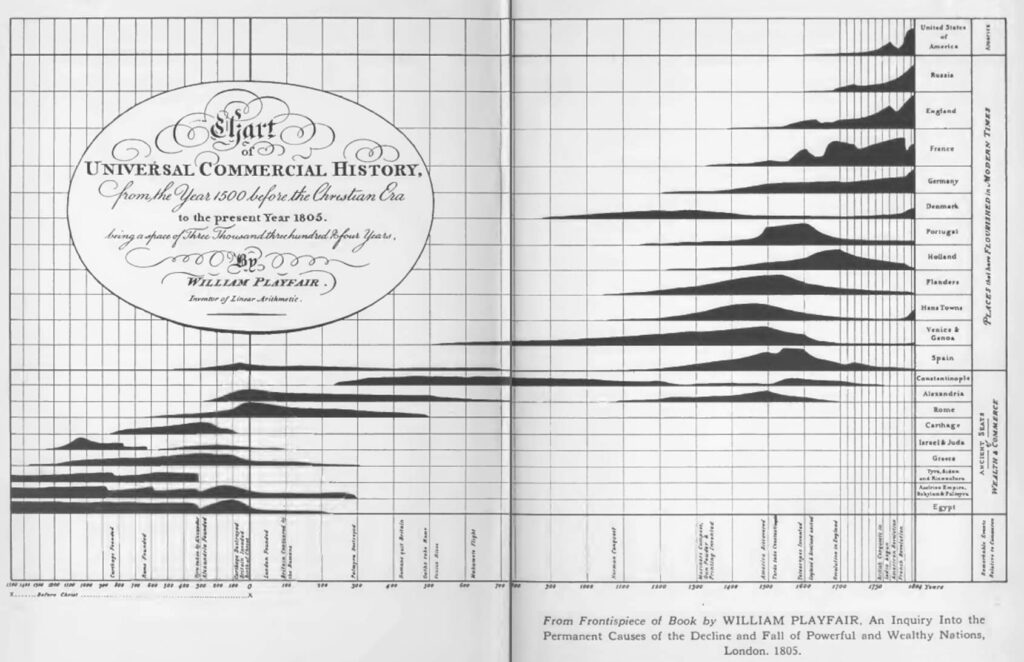
7 Data Storytelling Tips From Centuries-Old Data Visualization
Data visualization has a long history, hundreds of years. Data designers coaxed numbers into telling stories and giving us insight into the world around us. Here are seven lessons learned:
1. Keep the Focus on the Data
2. Label for Comprehension
3. Choose the Most Effective Data Visualization
4. Tell a Comprehensive Story
5. Order data for comprehension
6. Compare for Context
7. Make it Beautiful
https://www.columnfivemedia.com/7-data-storytelling-tips-from-centuries-old-data-visualization/
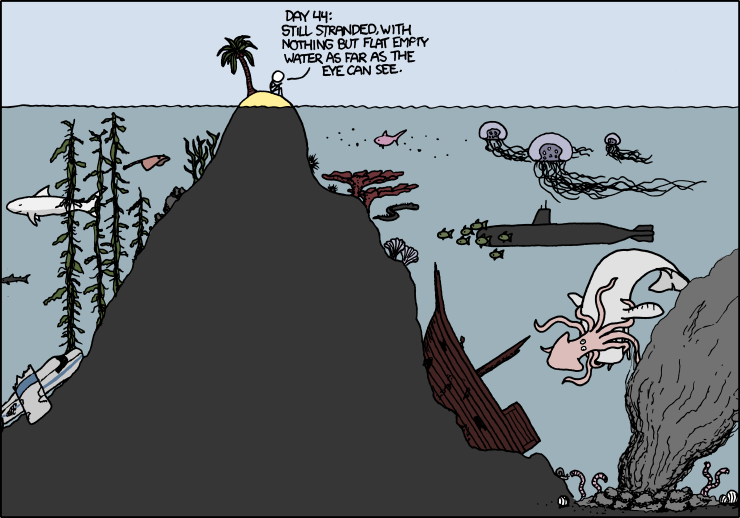
On a deserted, wave-swept shore, He stood – in his mind great thoughts grow
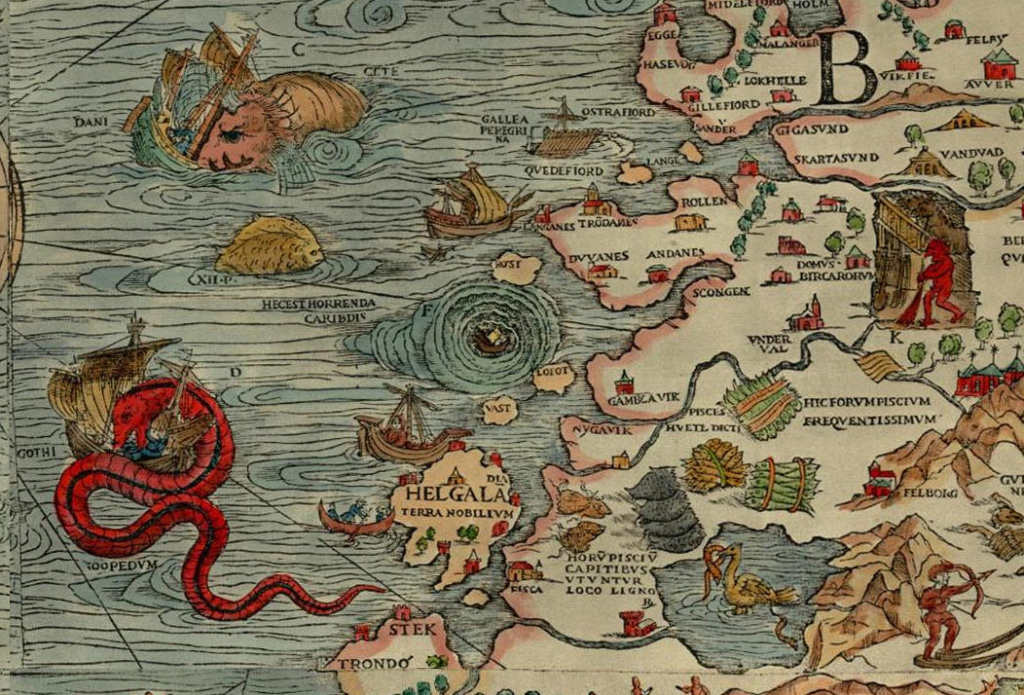
While sitting on a beautiful hill and overlooking the tranquil expanse of water, it is difficult to notice the pulse of life there, in the depths. Sometimes on the surface appear ripple-like patterns from whales’ tails or submarine periscopes, which could provide only a sketchy idea of the life in depths. Over time, scientists have created a number of tools to explore the depths, which fall into one of two large groups. In the first case, we catch a particular instance from the abysmal depths and study it in details. However, we do not care how numerous are such specimens, how they interact in the ecosystem and so on. In the second case, we consider the system as a whole — we track shoals of fish, water flow or distribution of volcanic emissions. In that case, we care little to none what happens to specific instances, we are interested in macro-phenomena.
In the social sciences, we use exactly the same tools — roughly speaking, case studies and statistics, each having their own pros and cons.
Case studies (focus groups, in-depth interviews and other similar methods) allow looking deeper into the problem, describing it in detail and in colors, highlighting some features that are difficult to see otherwise. However, such stories are not representative, and reflect the particular specific case. We have too many variables in our society, and it is too hard to pick a «typical representative» (try to find «a typical representative of your country» or «a typical country in Central Asia»), and there is no guarantee that that his or her experience would be typical.
On the other hand, namely statistics, operating with large numbers, can highlight the typical cases, trends and other average values, by which you can judge a society as a whole. The trouble is that most of these indicators gives an understanding of underwater life, roughly speaking, by ripple-like patterns from whales’ tails or submarine periscopes. Razor of research hypotheses completely cuts out the flesh of meaning from the bones of numbers.
There are numerous and repeated attempts to befriend a variety of tools that would give us understanding what’s going on in the depths of society. For example, the article «Managing Yourself: Zoom In, Zoom Out», published in the Harvard Business Review, offers a very simple approach — zoom in or out of the problem as a map in Google Maps. When the map is zoomed out, one can see the mountain ridges, state borders and big highways. When the map is zoomed in, these are dropped out of sight, but one can distinguish individual neighborhoods, streets, and houses. At zoom out one can see the problem in context, while zooming in allow to see important details that are blurred in zoom out.
Cognitive Edge offers a similar tool, which brings together stories, «micro-narratives» and the meta-data about these stories. In this case, research hypotheses do not play a major role. Certain «patterns» of stories begin to emerge when a large number of stories is collected and plotted around certain metadata options — whether the story about the past, present, or future? Is the story about corruption, cooperation or competition? In this case, accuracy of the sample is not so important — whether in the cluster 400 or 401 story does not matter at all. What is more important is appearance of such a cluster. It is possible to go in more deeply analysis, using the layers of clusters by adding variables — demographic characteristics of the storytellers, the emotional background of stories, and so on. Moreover, the tool allows you to «dive» deep into the cluster and catch the specific history, thus merging the statistics and personal experience .
This combination is very useful — politicians and decision makers rarely hear the voice of the people, relying on public opinion studies, and other average values. Using this tool allow one, sitting on the hill, to observe the beat of life at all stages of program or project — analysis, design , implementation, monitoring and evaluation.
This article is also featured in Voices from Eurasia, available in Russian.