Could Kyrgyzstan be first to send people on Mars?

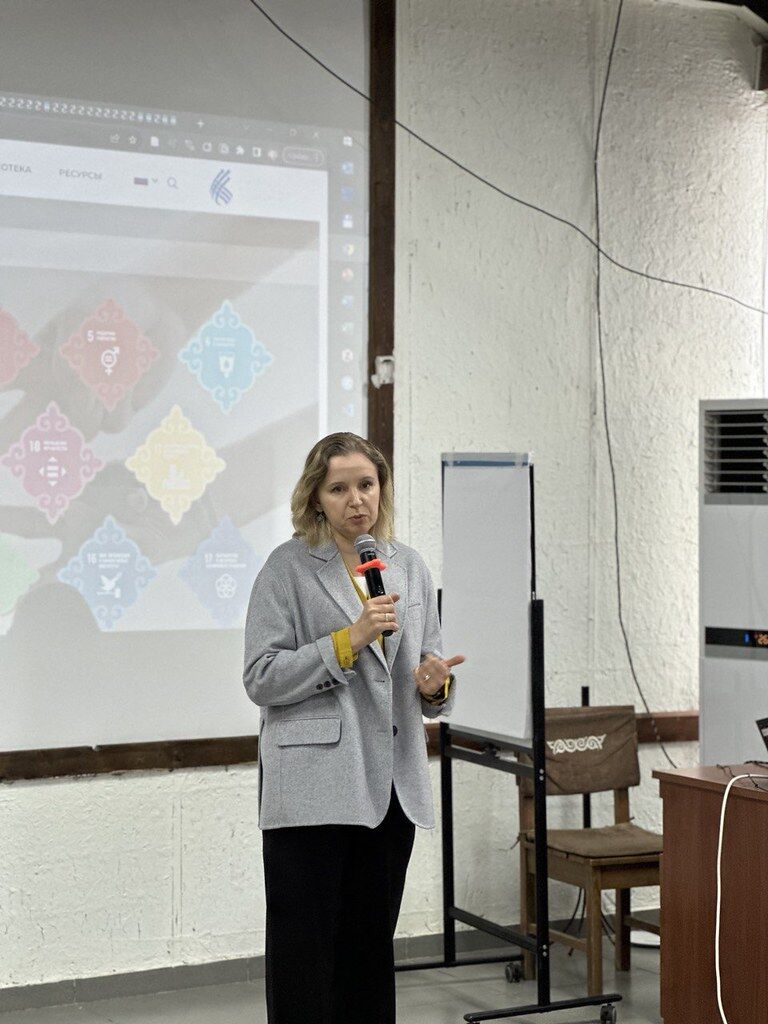
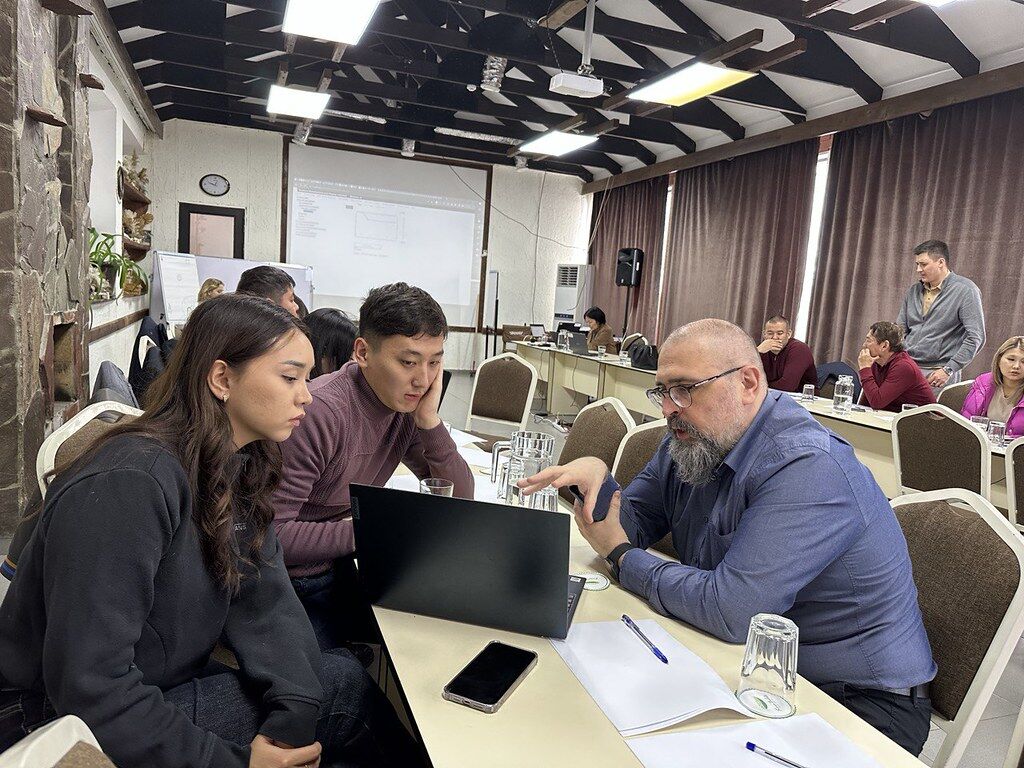
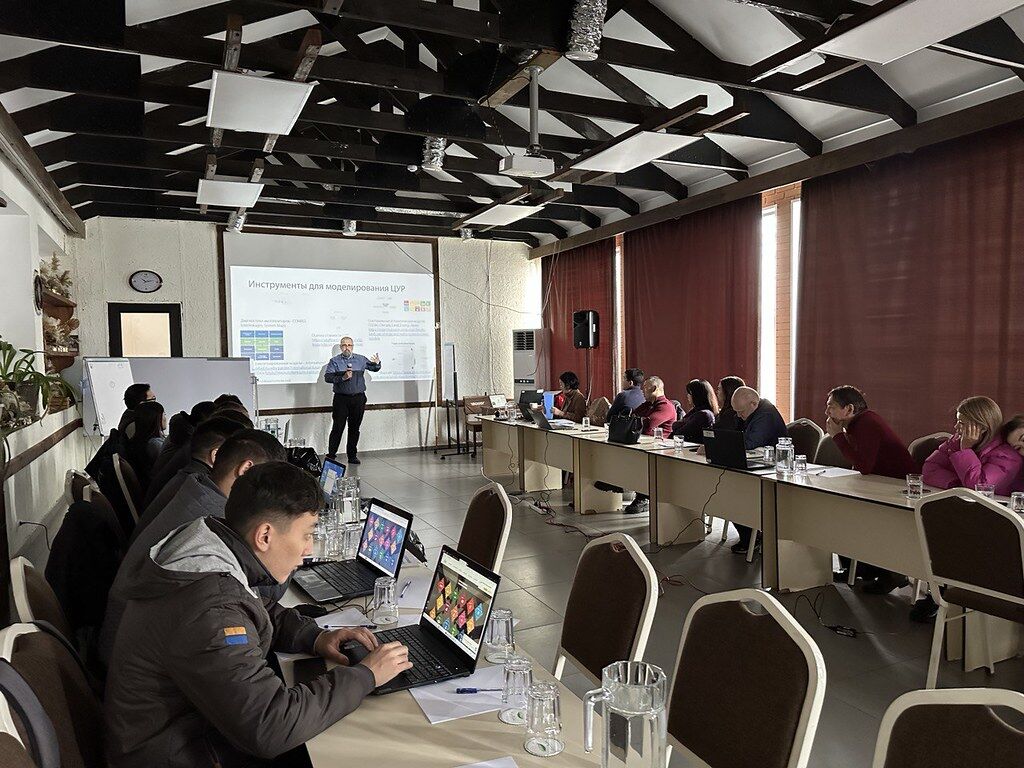
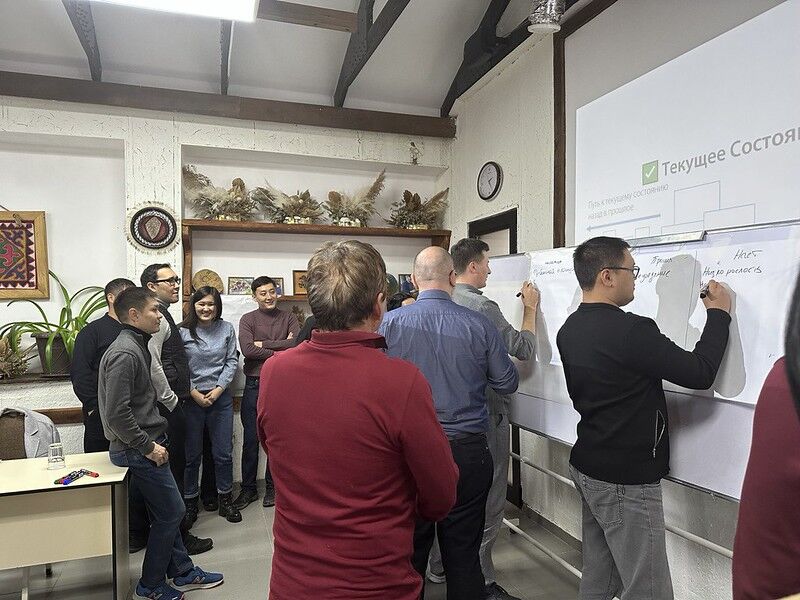
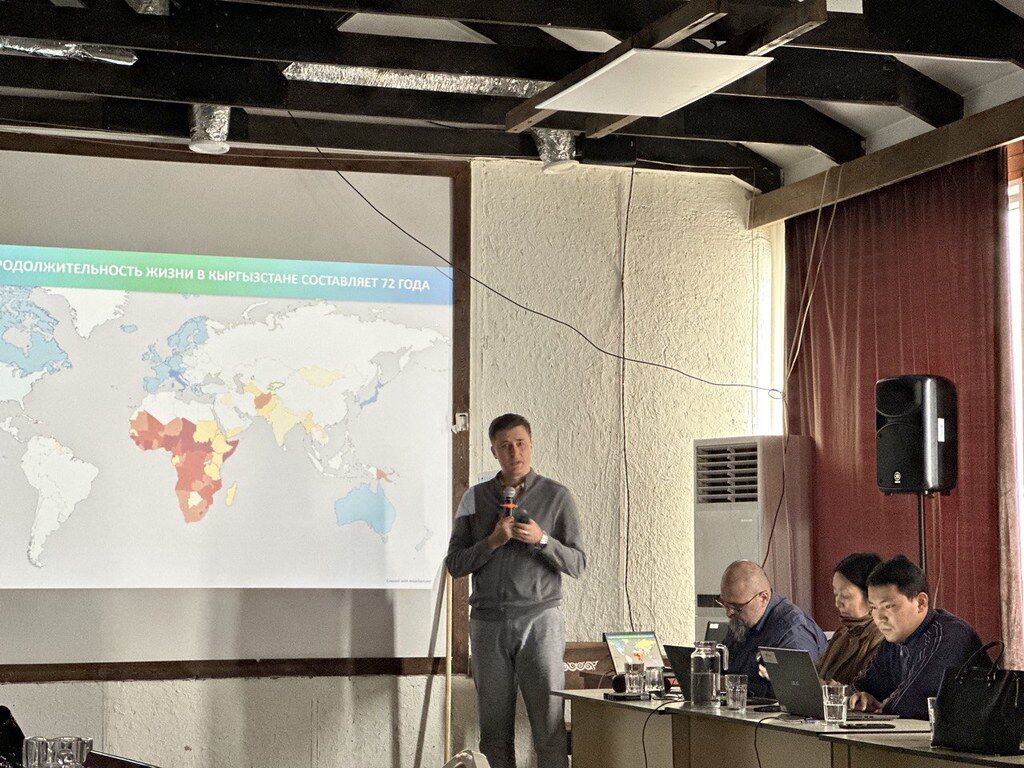
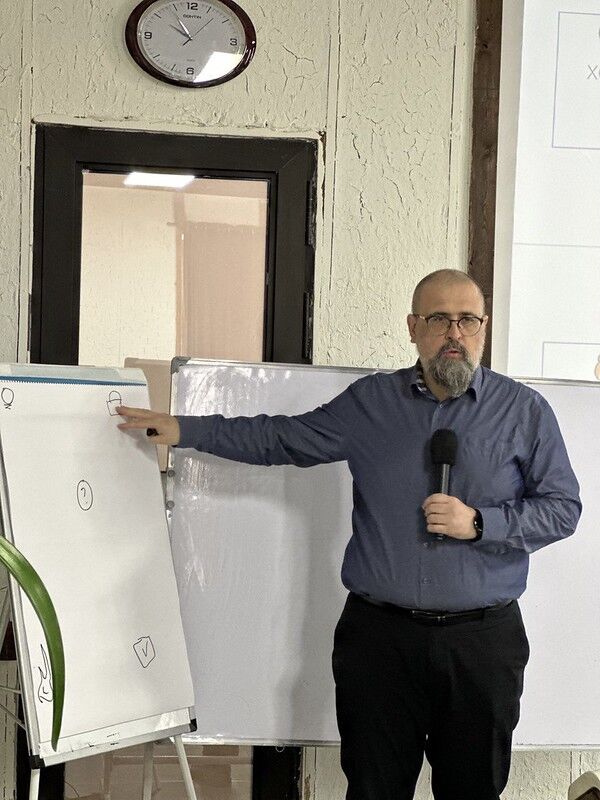
Had a great pleasure to facilitate the “Modelling for the SDGs” workshop organized by UNDP Kyrgyzstan this Saturday, 14 October 2023, a vital step in the collective journey to achieve the Sustainable Development Goals in Kyrgyzstan and CentralAsia. We combined different tools to explore possible futures.
We are using the International Futures Model by Frederick S. Pardee Center for International Futures for trends projections.
We also explored an IMPOSSIBLY good and bad futures, Utopia and Dystopia–Kyrgyzstan being the first to send people on Mars; and country fully depopulated by the Martian Plague. For this exploration we used Future Backwards method by The Cynefin Company (formerly Cognitive Edge)
It was great to see how tools help unlocking the deep discussion and spot the turning points in the journey to future(s)

Patterns and Drivers of Health Spending Efficiency

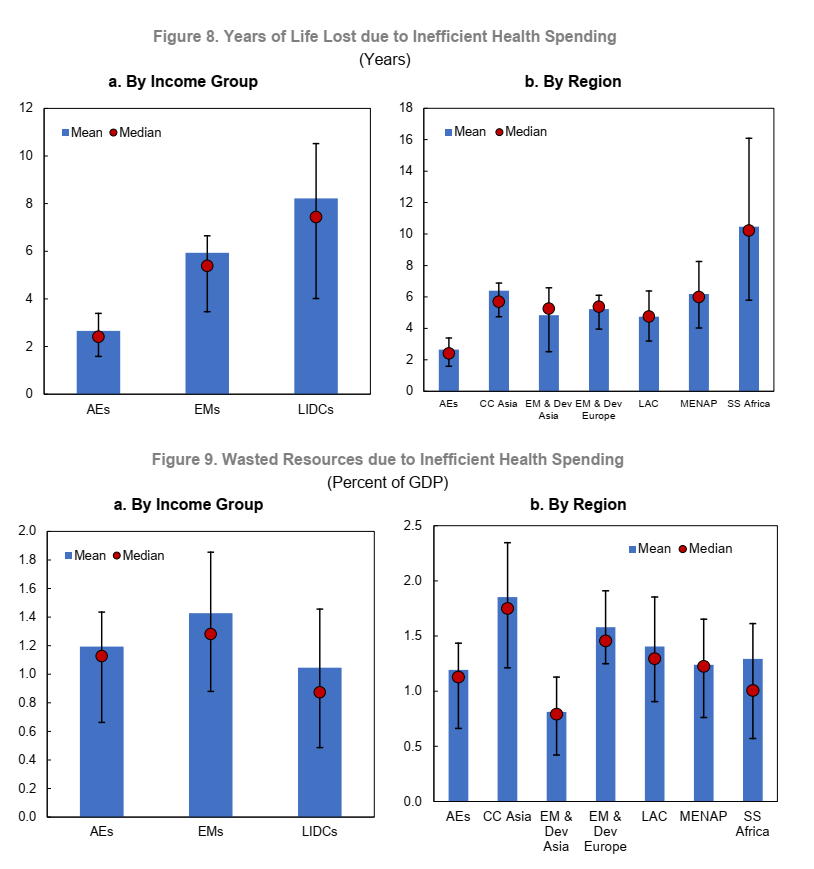
Health issues are high on public policy agenda. Health-related Sustainable Development Goals are yet to be achieved, COVID-19 pandemic is still on, and ageing population requires additional health services. Demands for health expenditures are at an all-time high all across the globe, while the fiscal space is limited. Not surprising, policymakers focus attention on ensuring that resources are used efficiently. This chart of the week shows losses—in terms of years of life and percent of GDP—due to health spending inefficiencies. It comes from the recent IMF Working Paper “Patterns and Drivers of Health Spending Efficiency”, which considers input- and output-oriented measures of (in)efficiency, depending on country distance from the frontier of expenditures-life expectancy.

The paper explores other patterns in efficiency across income groups, regions, and time, and the fiscal and years-of-life losses due to how health resources are spent. It goes further in exploring the question of drivers of health expenditure inefficiency, focusing on three major drivers: universal health coverage with essential services, income distribution, and corruption.

Universal health coverage is a crucial driver of health efficiency. If each country were to achieve, for each policy variable, the 75th percentile of its income group, low-income developing countries (LIDCs) would on average benefit from an increase of 3.4 years of life, while emerging markets (EMs) would gain 2.2 life years. Measured in expenditures savings, EMs and LIDCs to benefit from 0.39 and 0.37 percent of GDP. A more equitable distribution of income brings lower but still substantial gains in life expectancy by 1.7 and 2.1 years for EMs and LIDCs, respectively—or bring in savings of 0.17 and 0.12 percent of GDP. Better control of corruption is important, especially for EMs, which can benefit from an additional 1.6 years of life expectancy or avoid the waste of 0.27 percent of GDP in health spending. LIDCs gain 0.7 years of life expectancy or save 0.1 percent of GDP.

Maping ecosystem services contribution to SDGs for Small Island Developing States

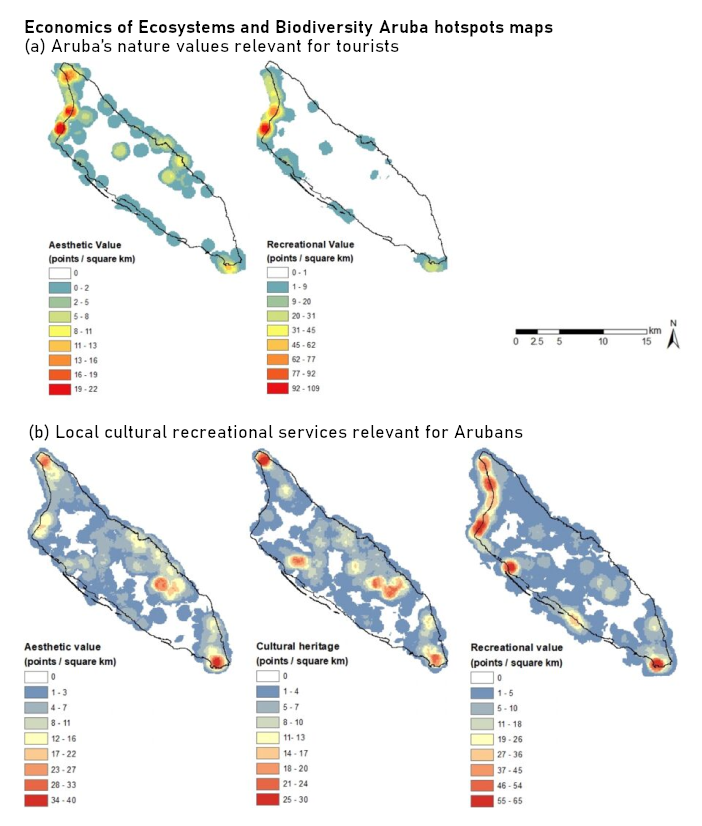
Marine and coastal ecosystem services play cruicial role in the economy and well-being in Small Island Developing States. These services could contribute to common challenges in achieving the Sustainable Development Goals. Fact-based solutions, based on linking ESS and SDGs, are essential for nature conservation and sustainable development in SIDS. The recent study developed an approach to capture the contribution of ESS to the achievement of SDGs in Aruba.

The study quantitatively capture the contribution of three ESS to the achievement of priority SDG targets, as well as interlinkages between priority SDG targets. Lack of data for many of the ESS is an issue widely by local stakeholders in Aruba. A shortlist of indicators provided appropriate metrics of the socio-economic value of fisheries and socioeconomic data on nature-based tourism. This chart, a hotspots maps provides information on how Arubans perceive the importance of nature for cultural and recreational activities and their well-being.

#SIDS #ESS #ecosystemservices #SDGs #SDG14 #chartoftheweek #Aruba

Food Crisis and Role of Social Protection

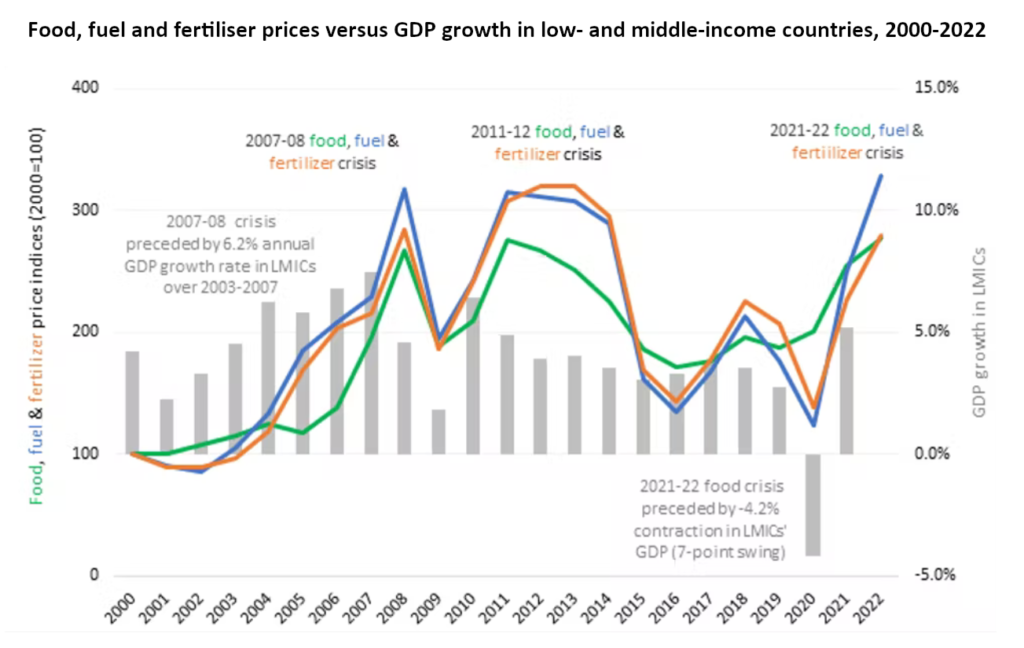
The 2022 is going to be a very difficult year for the global food system, due to disruption of supplies and effects of sanctions caused by Russia’s invasion of Ukraine. This chart from UNU-WIDER suggests that a food crisis was brewing even before the Ukraine war.

A combination of factors could make it much worse than hikes of 2008 and 2011-2012

1️⃣ This time it is compounded and still unfolding—we witness growing prices for cereals AND fuels AND fertilizers. Worst yet to come. Between 2019 and March 2022, cereal prices already has increased by 48%, fuel prices by 86% and fertiliser prices by 35%. Food, fuel and fertiliser prices could stay high for years if the war in Ukraine protracts and the isolation of Russia’s economy tightens

2️⃣ The poor are still recovering from the COVID-19 crisis, which had the most severe economic impact on the urban poor. Food price inflation is higher than CPI in many countries of the world, hurting the most vulnerable

3️⃣ Governments have little room to manoeuvre, due to shrinking tax base and growing dets debts for the unprecedented protection for households and businesses during the pandemic.

▶ What could be done?

Most impactful measures are increasing food supply and increasing fuel supplies to help bring down fuel and fertiliser (inter alia through resolving logistical bottlenecks and reducing shipping costs). However, it is not clear if countries are willing and ready to implement these measures.

Social protection could provide necessary support, via food or financial aid. These measures require concerted efforts of international institutions, governments, local actors, NGOs and the private sector. International community must help governments, facing tough post-pandemic fiscal circumstances, to mobilize resources for social protection. Combining universal programs with targeted programs could help to make the most of constrained fiscal space. World Bank real-time review of social protection and jobs responses to COVID-19 documented 3,856 social protection and labor measures planned or implemented by 223 economies Advanced big-data-driven technologies, like artificial intelligence and machine learning, could help in better targeting. However, they should be complemented with thick data and human solidarity to ensure proper combination of empowerment and protection.

How COVID-19 caused a global learning crisis

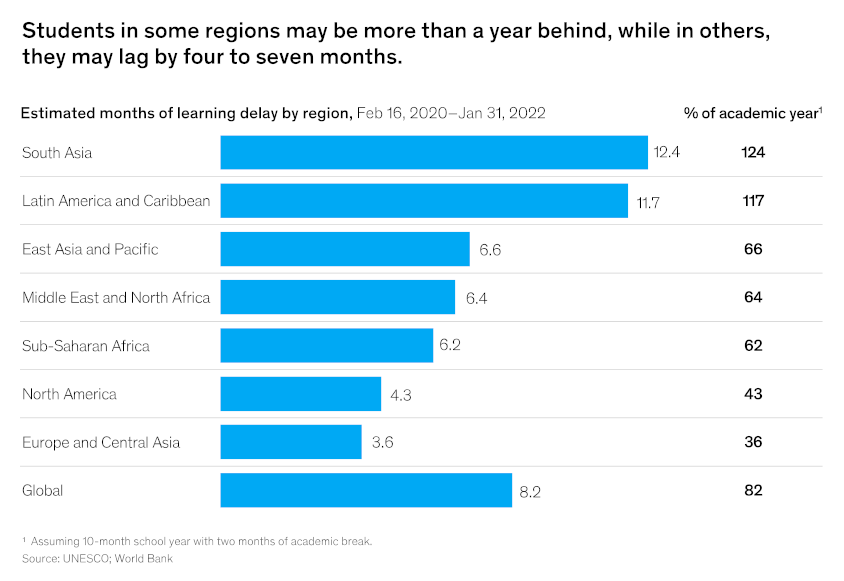
COVID-19 can undermine life-long perspectives of young people. Students globally lost eight months of learning and the impact varies widely from staggering 12 months in South Asia and Latin America and Caribbean to modest 4 months in North America and Europe and Central Asia. Recent McKinsey study identifies three archetypes of countries:
🚩 Most affected countries with moderate levels of pre-COVID-19 learning and significant delays in education, where students may be nine to 15 months behind.
🚩 Prepandemic-challenged countries, with very low levels of pre-COVID-19 learning, where losses were daunting but not so dramatic in absolute terms, about three to eight months
🚩 Least affected are high-performing countries, with relatively high levels of pre-COVID-19 performance, where losses were limited to one to five months.

Lower levels of learning translate into lower future earnings potential for students and lower economic productivity for nations (📉 losing 1 percent of global GDP annually, according to McKinsey estimates). By using scenario modelling UNDP came to similar conclusions. The study shows how governments can make choices today that have the greatest potential to boost progress in the future. School systems can respond across multiple horizons to help students get back on track: ⭐Resilience, 🔁Reenrollment, 🔼Recovery, and 💡Reimagining.

Disaggregation Dizziness

Still Life with Apples and Oranges, 1895 by Paul Cezanne

Recently I had a great pleasure and honor to attend the International conference on the implementation of a national system for monitoring the Sustainable Development Goals. The conference brought together statisticians, policy makers, and international organizations to discuss how to challenges in measuring sustainable development, in monitoring of SDGs. Everybody asked for better data disaggregation, for each indicator (let me remind you that current SDG monitoring framework contains 230 indicators). Statisticians listened this with caution, then did back of the envelope calculations and discovered that they would need to calculate each of 230 indicators for some 40+ groups, if take into account all break downs proposed (by sex, poverty status, disability status, and so on and so on, and this does not include territorial division, which could be different for each country). These number make you dizzy. Without doubts, it will put enormous pressure on Statistical Services, who still are looking for ways to produce all required SDG indicators (as significant part of them are still in Tier II or III, i.e. “established methodology and standards available but data are not regularly produced” and “no established methodology and standards“).

Without doubts, disaggregation of indicators is indispensable, especially to ensure that Sustainable Development Goals leave no one behind.  The issue is how to balance costs and opportunities?

First, it should be clarity on why, how, and what we disaggregate. The groups we identify—”women”, “rural”, “children”—are not that heterogeneous as we tend to think. These identities are not unique, often combined, resulting in very different people being counted under the same category—compare, for instance, situation of “Roma low educated woman with disabilities living in rural settlement” and “highly-educated woman living in economic center“. Trying to imaging all possible combinations makes you dizzy and inevitably ruins your friendship with statistician. In many cases the line between groups is also very blurry, while statisticians prefer crisp definitions. Possible solution is proposed by Todd Rose in “The End of Average: How We Succeed in a World That Values Sameness“. Instead of mundane “aggregate then analyze” you should “analyze then aggregate“. Being applied wisely, this approach could bring great results—it allowed Mexico to estimate Human Development Index for very diverse groups, including internal migrants; and us to compare and understand social exclusion of different people in Europe and Central Asia.

Second, we should ensure that data collection instruments include all necessary information for future disaggregation. This issues is not that trivial as it seems. For instance, many indicators calculated on the basis of household surveys—like poverty rates or calories consumption—could be gender-blind (or, more precisely gender-myopic) as these surveys do not catch intra-household distributions and inequalities. Collecting ethnic-related data could be challenging not only due to fluid and double identities, but also due to national regulations. Some hard to reach groups—who tend to be left behind—could be simply left out of statistics viewpoint. At the same time, providing geographical information offers great opportunities in linking with other data sources and getting more disaggregated, nuanced picture.

Last but not the least, we should promote practice and culture of data use. Statistical offices are very busy with data collection, production, and dissemination. If you peek into statistical yearbooks, you will find indicators tabulated for dozens of different groups. However, this is a role of scholars to do additional analysis, explore possible disaggregations, and perhaps suggesting statistical services useful revisions of regular tables. In Serbia collaboration of  Social Inclusion and Poverty Reduction Unit of the Government, Statistical Office with UNDP resulted in set of studies, which help formulating efficient public policies for social inclusion.
 

Sustainable Development Goals as a Network of Targets

12009662_882179671871702_8487110901368455942_n[1]Sustainable Development Goals, to be adopted by the United Nations summit at the end of September 2015, will set up international development agenda for next 15 year till 2030. SDGs are making a serious step forward from their ancestor, Millennium Development Goals. Lack of integration across sectors in terms of strategies, policies and implementation has long been perceived as one of the main pitfall of previous approaches to sustainable development. SDGs offer more comprehensive and more integrated approach sustainable development. The backside of this more complex agenda is necessity to understand internal links and trade-offs, both explicit and implicit.

One way to embrace complexity is too look on SDGs as a network of targets:

Another way to embrace complexity is to consider extended SDG Goals, which include not only targets listed under each goal (which reflect long negotiation and consultation process rather than internal logic), but also those from other Goals logically linked to the current goal. Here area a couple of examples:

SGD1 Poverty reduction
SDG1: Core
SDG1: Extended

SGD8 Growth and Jobs
SDG8: Core
SDG8: Extended

also see Goals 1, 10 and 8 highlighted
Cluster of 1, 8, 10, and 16 (extended)

Some themes—like migration—do not have a specific goal, they are related to a number of  targets, linked to different goals.

Indicators to measure SDGs should also take into accounting this complexity

Innovative visualization to explore compelxity of SDGs as a layered network (codename “Funky Octopus”)

See also:

Creative Commons License
SDGs as a network of targets by Mike Peleah is licensed under a Creative Commons Attribution-NonCommercial-ShareAlike 4.0 International License.
Based on a work at https://peleah.me/sdgs-as-network/.