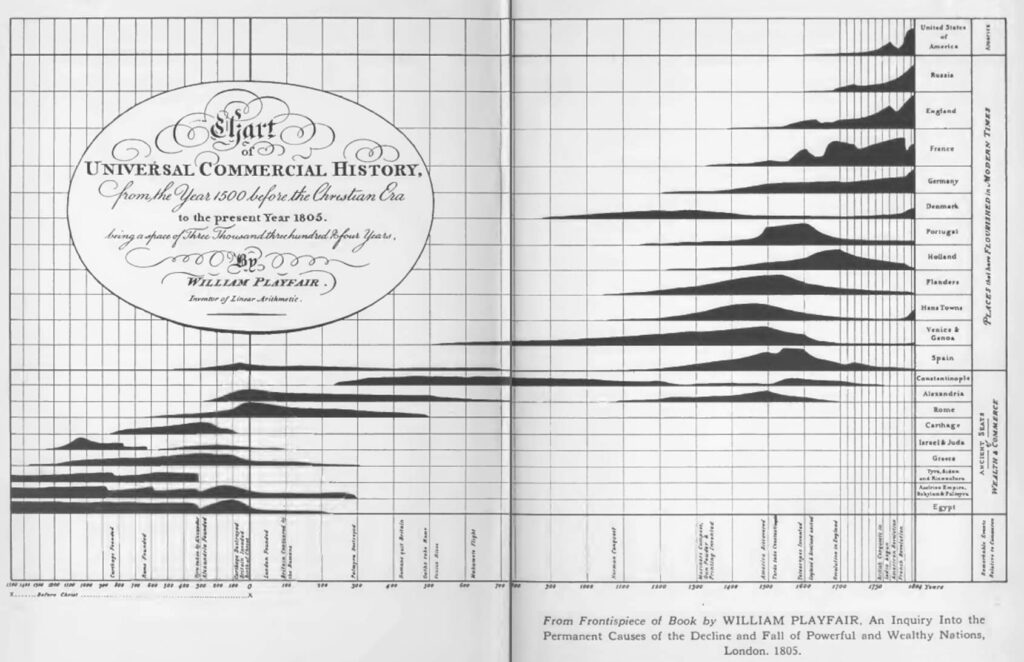
Data visualization has a long history, hundreds of years. Data designers coaxed numbers into telling stories and giving us insight into the world around us. Here are seven lessons learned:
1. Keep the Focus on the Data
2. Label for Comprehension
3. Choose the Most Effective Data Visualization
4. Tell a Comprehensive Story
5. Order data for comprehension
6. Compare for Context
7. Make it Beautiful
https://www.columnfivemedia.com/7-data-storytelling-tips-from-centuries-old-data-visualization/

