
Many years ago my son was struggling with the Pythagoras theorem in school. He simply was unable to get it. We tried different approaches, and finally I suggested “Why won’t you dance it? Or play it on your guitar?” (He was very much in torturing the Les Paul that time)
While the idea could be a radical, it makes a lot of sense. When we work with data, with numbers, we are dealing with abstractions. This could be useful, no doubt. But it also could be deprived of meaning.
— Your greatest weakness?
— Interpreting semantics of a question but ignoring the pragmatics
— Could you give an example?
— Yes, I could.
As a Chemistry Teacher by the first degree, I was trained to provide relatable examples to chemical phenomena, which could be too small or too big to comprehend. You could have a hard time to imagine an atom, they are too small. But I could tell you that if the electron orbit around the the hydrogen atom (5.29×10⁻¹¹ m or 52.9 pm) would be scaled to the size of stadium (football field is usually 100 meters long and 60 meters wide, Beşiktaş Arena building is 220 by 165 m), then the hydrogen nucleus (1.70×10⁻¹⁵ m or 1.70 fm) will be of size of .. a small berry (some 5×10⁻³ m or 5 mm), not even a ball (7×10⁻¹ m or 70 cm). As a home work you could compare sizes of the Sun and the Earth orbit 😉
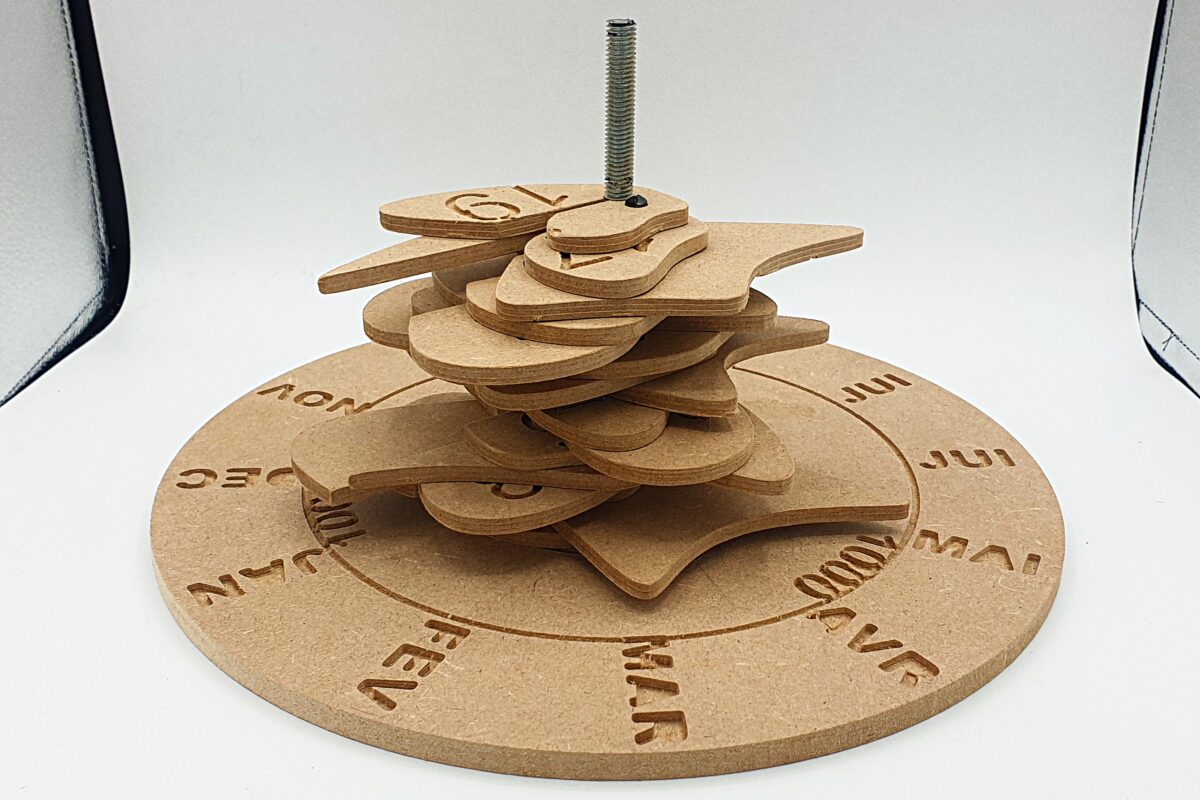
This week I ran across “datasculptures”, a physical and visual representation of data, in this case–the complete history of one river. To quote the author, the approach is a form of counter-mapping, both tactile and sensible, but also involving a slow-making process and another kind of relationship to the data and the river it concerns. Sculpting environmental data is a proposition to map geographical entities that go around the “from above” and “far away” traditional views to open new ways of re-embedding time and materiality into cartographies.
This could be pure fun on the bun! In 2018 I attended a breathtaking summer school on Analysis of Linguistic Data (LingDan). We played around with different data related to language–sounds, words, signs. I used a Romanian / Moldovan tongue twister consisting of vowels only “oaia aia e a oaiei ei” (meaning “that sheep belongs to that sheep”). The interesting thing about vowels is that they differ systematically in the frequencies of so-called “formant” sounds, so you could record, measure and map them. I thought it could be a good idea to show the “dance” of vowels–movement of sounds in a tongue twister–and produced a short data video. I also coaxed the fellow Dance Lab, who were in the next block, into human dancing about it.
Coming back to the Pythagoras theorem, one way to show it is a hydraulic sculpture. Another way is through visual puzzles, which could provoke a very good discussion in the classroom.
P.S. You could also check my “Numbers in a context” artish project