Could Kyrgyzstan be first to send people on Mars?

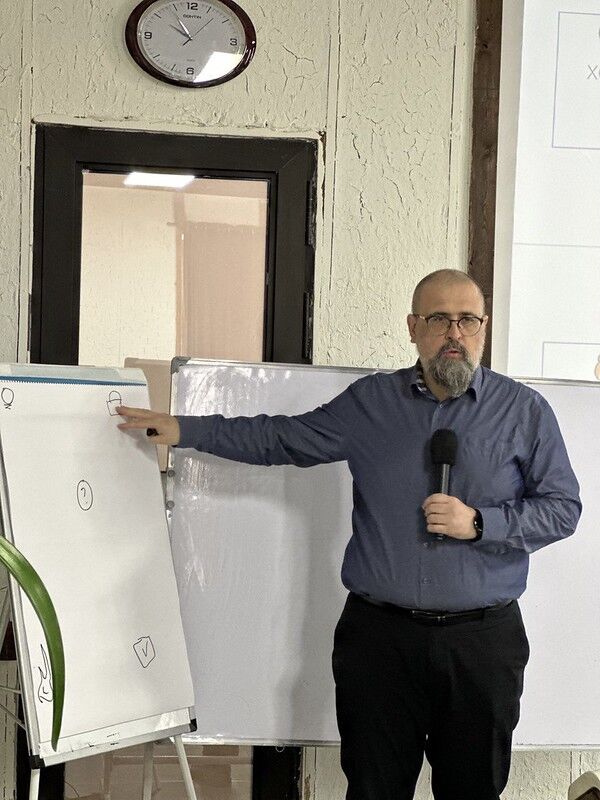
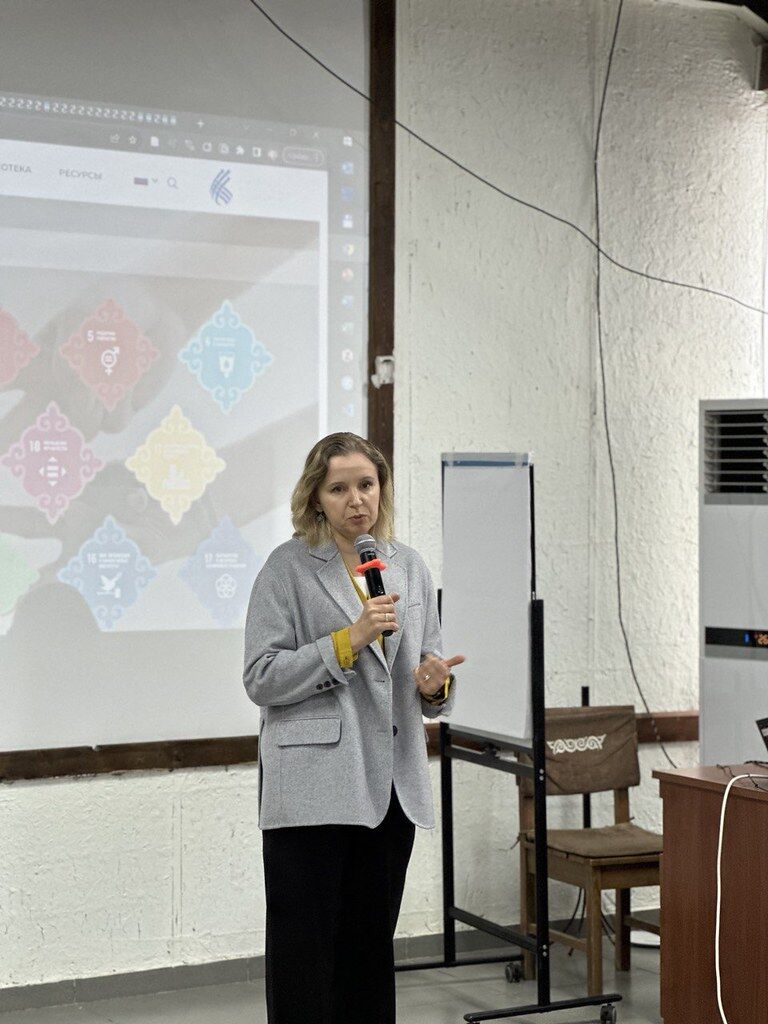
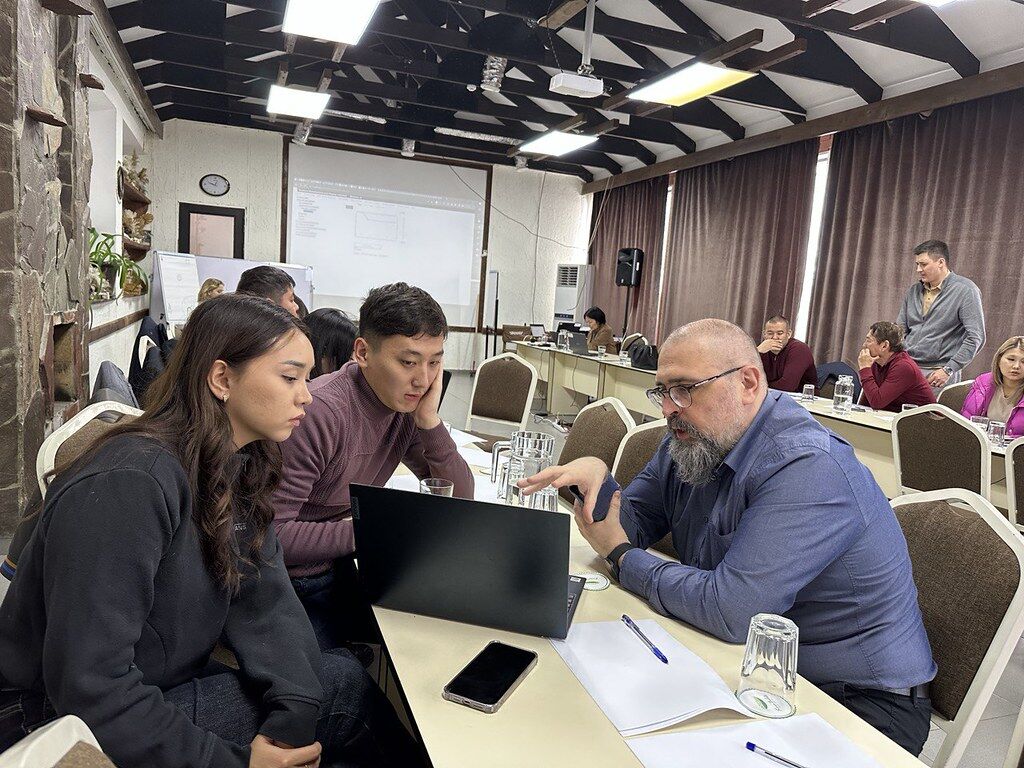
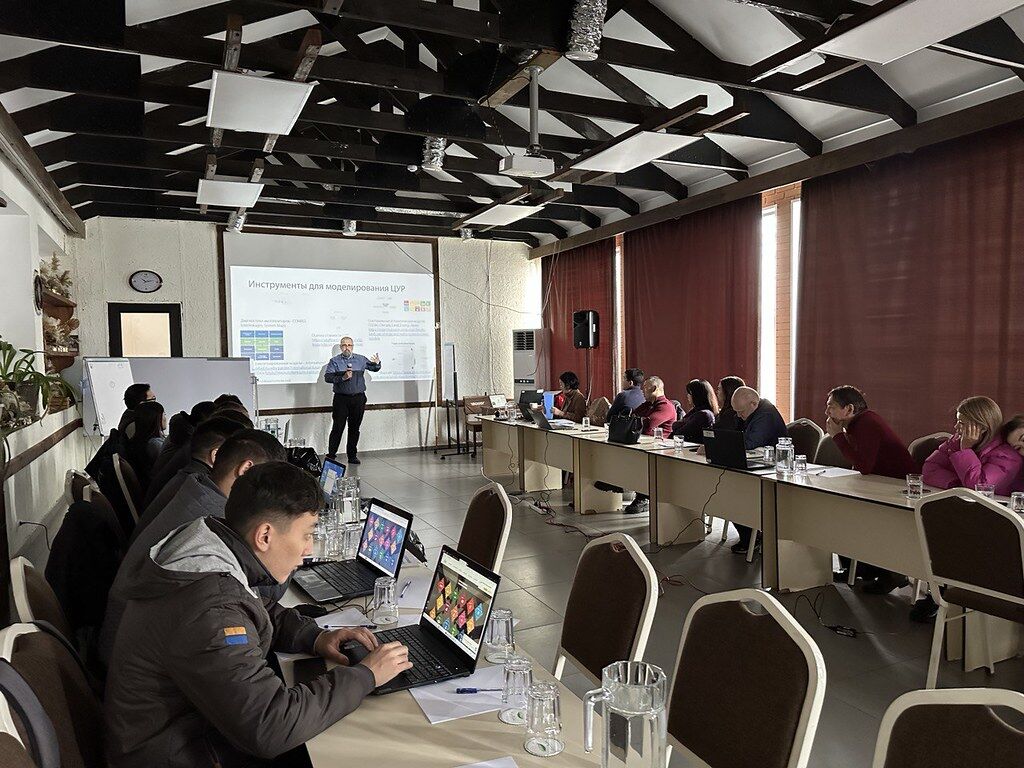
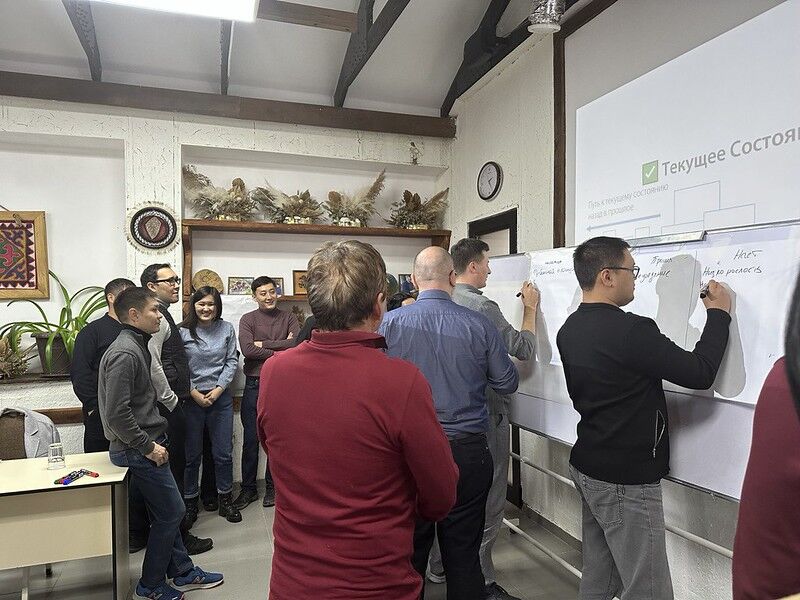
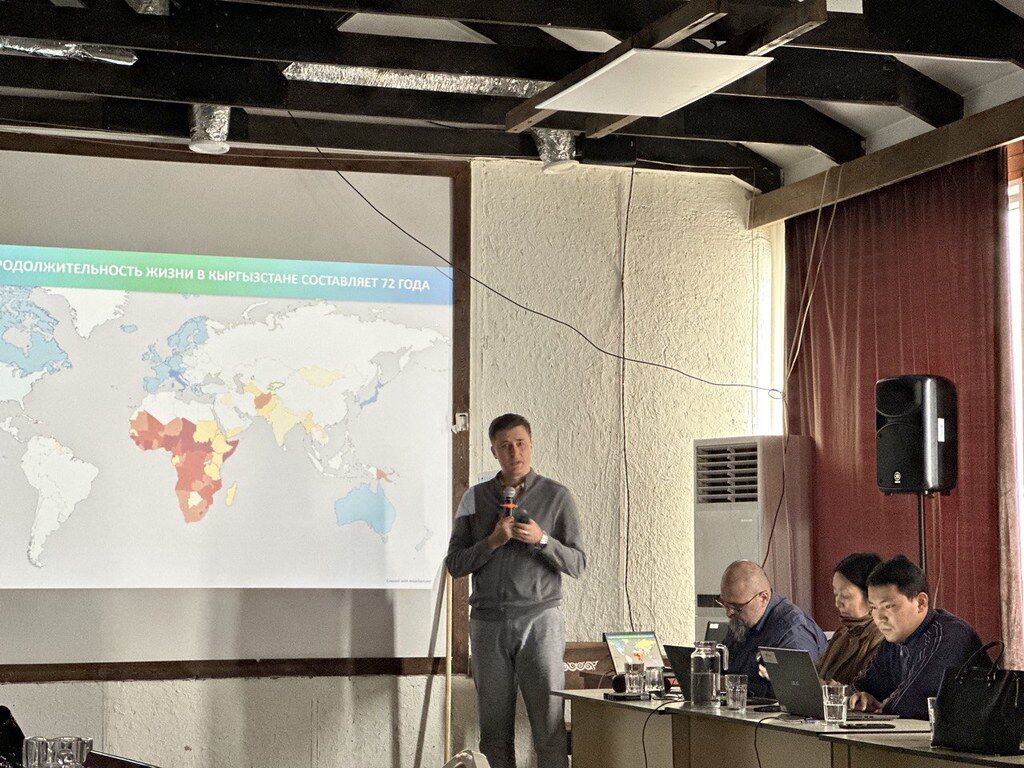
Had a great pleasure to facilitate the “Modelling for the SDGs” workshop organized by UNDP Kyrgyzstan this Saturday, 14 October 2023, a vital step in the collective journey to achieve the Sustainable Development Goals in Kyrgyzstan and CentralAsia. We combined different tools to explore possible futures.
We are using the International Futures Model by Frederick S. Pardee Center for International Futures for trends projections.
We also explored an IMPOSSIBLY good and bad futures, Utopia and Dystopia–Kyrgyzstan being the first to send people on Mars; and country fully depopulated by the Martian Plague. For this exploration we used Future Backwards method by The Cynefin Company (formerly Cognitive Edge)
It was great to see how tools help unlocking the deep discussion and spot the turning points in the journey to future(s)

Dancing with the Vowels

Many years ago my son was struggling with the Pythagoras theorem in school. He simply was unable to get it. We tried different approaches, and finally I suggested “Why won’t you dance it?  Or play it on your guitar?” (He was very much in torturing the Les Paul that time)

Human Pyramide, USSR, 1928, Source: https://kulturologia.ru/blogs/240419/42917/

While the idea could be a radical, it makes a lot of sense. When we work with data, with numbers, we are dealing with  abstractions. This could be useful, no doubt. But it also could be deprived of meaning. 

— Your greatest weakness?
— Interpreting semantics of a question but ignoring the pragmatics
— Could you give an example?
— Yes, I could. 

As a Chemistry Teacher by the first degree, I was trained to provide relatable examples to chemical phenomena, which could be too small or too big to comprehend. You could have a hard time to imagine an atom, they are too small. But I could tell you that if the electron orbit around the the hydrogen atom (5.29×10⁻¹¹ m or 52.9 pm) would be scaled to the size of stadium (football field is usually 100 meters long and 60 meters wide, Beşiktaş Arena building is 220 by 165 m), then the hydrogen nucleus (1.70×10⁻¹⁵ m or 1.70 fm) will be of size of .. a small berry (some 5×10⁻³ m or 5 mm), not even a ball (7×10⁻¹ m or 70 cm). As a home work you could compare sizes of the Sun and the Earth orbit 😉

This week I ran across “datasculptures”, a physical and visual representation of data, in this case–the complete history of one river. To quote the author, the approach is a  form of counter-mapping, both tactile and sensible, but also involving a slow-making process and another kind of relationship to the data and the river it concerns. Sculpting environmental data is a proposition to map geographical entities that go around the “from above” and “far away” traditional views to open new ways of re-embedding time and materiality into cartographies.

LOIRE’S RIVER FLOW HISTORY (MONTHLY DATA 1960-2022)


This could be pure fun on the bun! In 2018 I attended a breathtaking summer school on Analysis of Linguistic Data (LingDan). We played around with different data related to language–sounds, words, signs. I used a Romanian / Moldovan tongue twister consisting of vowels only “oaia aia e a oaiei ei” (meaning “that sheep belongs to that sheep”).  The interesting thing about vowels is that they differ systematically in the frequencies of so-called “formant” sounds, so you could record, measure and map them.  I thought it could be a good idea to show the “dance” of vowels–movement of sounds in a tongue twister–and produced a short data video.  I also coaxed the fellow Dance Lab, who were in the next block, into human dancing about it. 

Coming back to the Pythagoras theorem, one way to show it is a hydraulic sculpture. Another way is through visual puzzles, which could provoke a very good discussion in the classroom.

P.S. You could also check my “Numbers in a context” artish project

The Rise of the Data Elite: How AI Research is Re: inforcing Power Imbalances

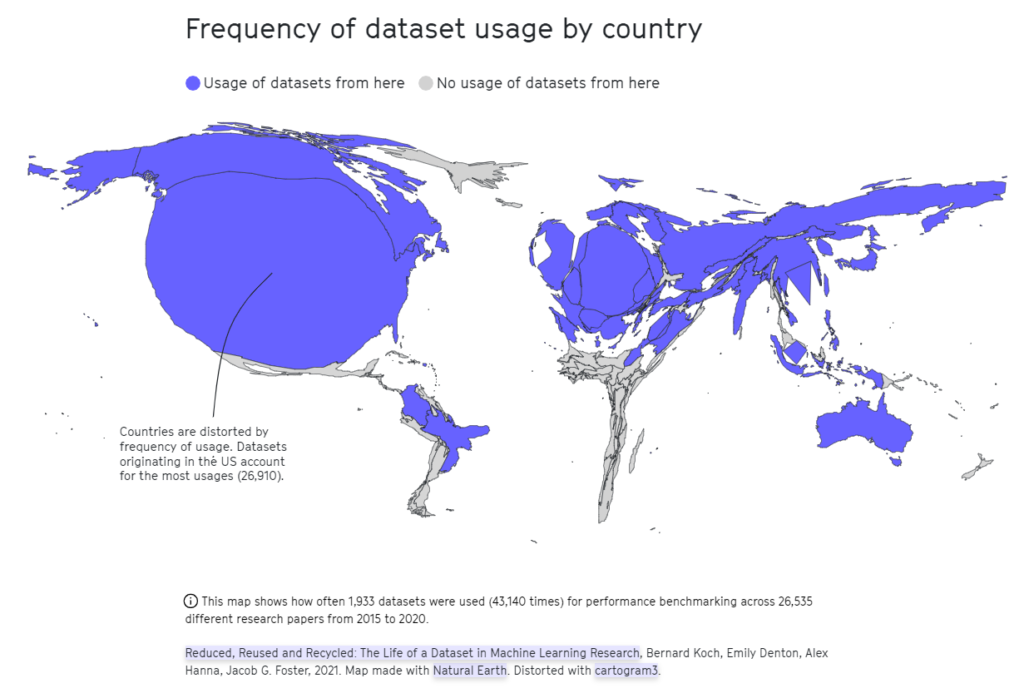
The rise of AI-powered tools is transforming our everyday lives. We use the magic of ChatGPT and Midjourney and more mundane AI-powered credit profiling and email completion tools. However, the democratization of AI use is accompanied by global power disparities in AI research. A chart from the “Internet Health Report 2022” shows that the landscape of AI research papers is heavily skewed towards a few countries and elite institutions. The map reveals that more than half of the datasets used for AI performance benchmarking were from just 12 institutions and tech companies in the United States, Germany, and Hong Kong (China).

This map shows how often 1,933 datasets were used (43,140 times) for performance benchmarking across 26,535 different research papers from 2015 to 2020.
Reduced, Reused and Recycled: The Life of a Dataset in Machine Learning Research, Bernard Koch, Emily Denton, Alex Hanna, Jacob G. Foster, 2021.

This major imbalance in the discourse about how AI should be used and who should benefit from it reinforces existing power imbalances. A discussion piece from Data Pop Alliance called “The Return of East India Companies: AI, Africa and the New (Digital) Colonialism” explores various aspects of AI colonialism in Africa. For instance, there is under-development of natural language processing (NLP) technologies for non-Western languages. Computer vision of self-driving cars relies on low-paid human workers to label hundreds of hours of data. Lax ethical standards and “data dumping” in countries with less stringent data protection regulations effectively renders local people and society—AI guinea pigs. Despite the decreasing cost of training machine learning systems and greater availability of data, the power dynamics in AI research and development continue to reflect the dominance of a select few.

While machine learning models and datasets are being developed in other parts of the world, their use in research papers and performance benchmarking is still limited. We have the power to seek greater diversity and inclusivity in AI research, and to advocate for ethical standards that address data inequalities–as consumers and as researchers. For example, the UNDP and UNICEF regional Eurasia platform STEM4ALL to promote women and girls, share knowledge, raise awareness, and break gender stereotypes in STEM. Another way is by promoting collaboration across borders and develop own datasets to contribute to the global conversation.

Birthday Opportunity: Natural experiment in Cash Transfers Investing in Infants

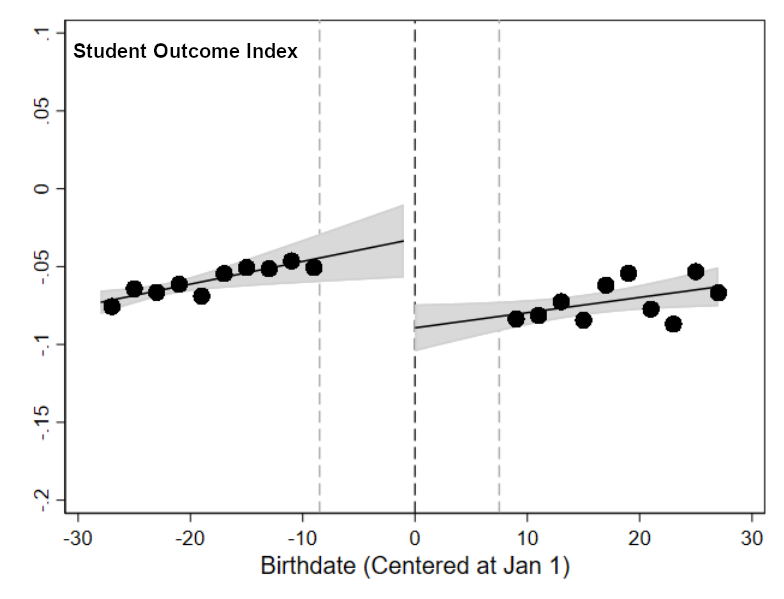
Cash transfers following the birth of a first child can have large and long-lasting effects on that child’s outcomes. Andrew C. Barr and two co-authors made use of natural experiment—the January 1 birthdate cut-off for U.S. child-related tax benefits. Children born in December of previous year are eligible for tax deduction, while children born just a couple of weeks later, in January, are not eligible. As a result, families with otherwise similar children receiving substantially different refunds during the first year of life—roughly $1,300, or 10 percent of income for the average low-income single-child.

Using the careful data connection strategy, authors showed that this transfer in infancy increases young adult earnings by at least 1 to 2 percent, with larger effects for males. Baseline estimates indicate that eligibility for additional resources during the first year of life generates a $319 increase in average annual earnings between age 23 and 25 and a $456 increase between ages 26 and 28. These effects persist to older ages, with 2-3 percent increases at ages 29-31 and 32-34. These estimated effects are larger than those generated by the in-kind support programs. According to calculations, additional tax receipts associated with the increased earnings in adulthood, exceed the amount of the initial transfer, implying a negative net cost to the federal government.

The observed earnings effects appear to be explained by earlier human capital effects. the North Carolina education data showed substantial increases in test scores, reductions in behavioural problems, and a greater likelihood of high school graduation during childhood and adolescence. This chart shows effect of cash transfer eligibility on student outcome index, constructed as the mean of normalized test scores in grade 3-8, high school graduation, and any suspension in middle or high school. Birthdates to the left of the dotted line represent those where the child’s family could have received additional resources from child-related tax benefits in the following year (if eligible based on income).

Andrew C. Barr, Jonathan Eggleston, and Alexander A. Smith (2022) “Investing in Infants: The Lasting Effects of Cash Transfers to New Families”. NBER Working Paper No. 30373, August 2022. http://www.nber.org/papers/w30373

Shades of Informality

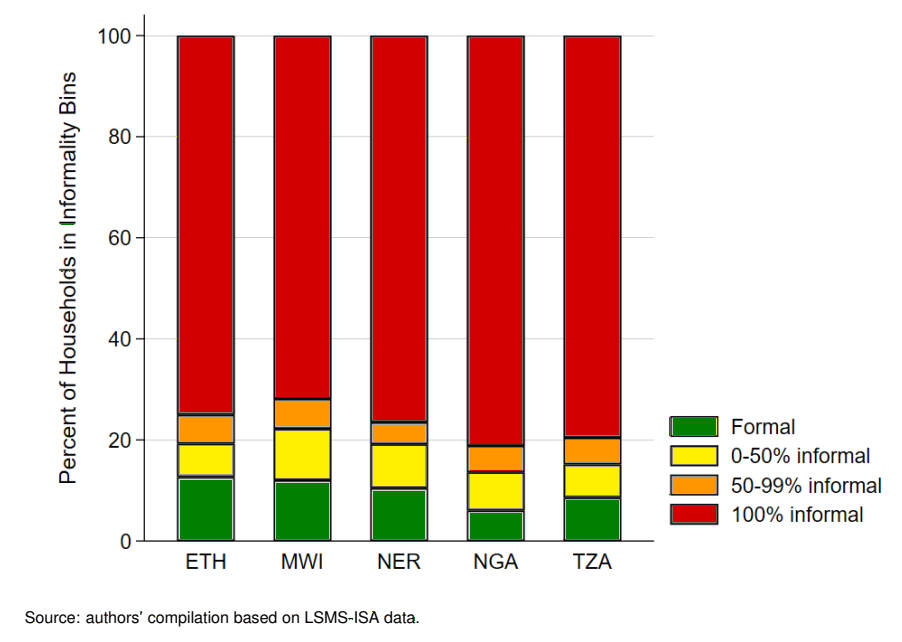
Informal employment attracts a lot of attention, because it is widespread but associated with risks. It lacks of insurance against shocks, and therefore directly related to vulnerability to poverty. Many Social-Economic Impact Assessments of COVID-19 showed that informal workers were particularly hit hard by turbulence in 2020-21. However, measurement of informality is not that simple. Most often used definition is lack of social and/or health insurance. Meanwhile, research has shown that formalization does not automatically lead to poverty reduction.

While there are many reasons why this link does not work automatically—flexibility of informal arrangements, hidden costs of formalization—one reason could be how we measure informality. We usually measure welfare on the family level, using household income or expenditure and assuming that families share these. However, informality is usually measured and analysed on individual level—individual workers, family firm, the household head—without making assumptions how risks and benefits of informality are shared in family. (There is a rich and growing body of literature on migration as a risk sharing, for instance “Risk Sharing and Internal Migration”) As a result, policies related to poverty reduction and reducing the risks of informality are often designed with different groups in mind—families and single individuals respectively.

This chart of the week comes from a recent paper “Welfare and the depth of informality. Evidence from five African countries”. It shows that there are shades of “informality”, rather than simply “Yes” / “No” dichotomy. The paper further investigates the relationship between welfare and informality at the household level. The findings confirm the nonlinear relationship between welfare and informality—families with some formal incomes are as well off as families with only formal income. Moreover, paper suggests that moving to full formality only translates to meaningful welfare improvements if the household income gain is sufficiently large.

Gimble in the Wabe

Recent developments in AI resulted in impressive tools, like a model for image generation. For instance, DALL-E 2 grabbed many headlines, as it can create realistic images and art from a description in natural language. While the generated images are impressive, basic questions remains unanswered—how does the model grasp relations between objects and agents? Relations are fundamental for human reasoning and cognition. Hence, machine models that aim to human-level perception and reasoning should have the ability to recognize relations and adequately reflect them in generative models.

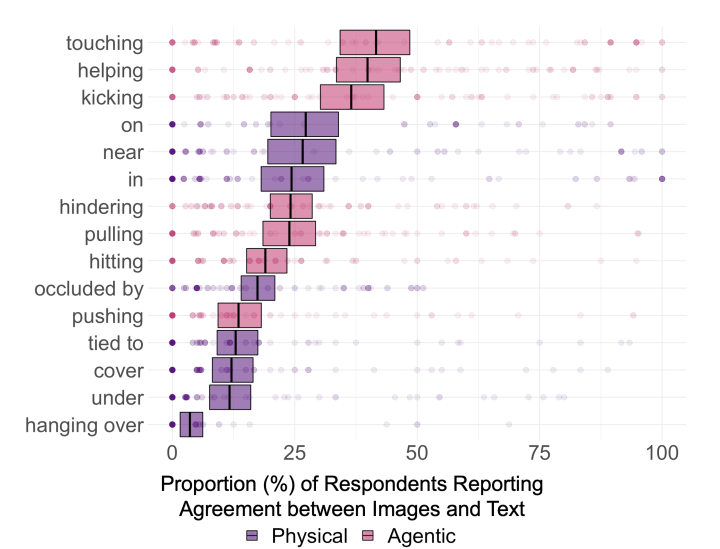
Recent paper “Testing Relational Understanding in Text-Guided Image Generation” puts this assumption in test. The researchers generated galleries of DALL-E 2 images, using sentences with basic relationships—e.g. “a child touching a bowl” or “a cup on a spoon”. Then they showed images and prompt sentences to 169 participants and asked them to select images that match prompt. Only some 20% of images were perceived to be relevant to their associated prompts, across the 75 distinct prompts. Agentic prompts (somebody is doing something) generated slightly higher agreement, 28%. Physical prompts (X position in relation to Y) showed even lower agreement, 16%. The chart shows the proportion of participants reporting agreement between image and prompt, by the specific relation being tested. Only 3 relations entail agreement significantly above 25% (“touching”, “helping”, and “kicking”), and no relations entail agreement above 50%.

The results suggest that the model do not yet have a grasp of even basic relations involving simple objects and agents. Second, model has a special difficulty with imagination, i.e. ability to combine elements previously not combined in training datasets. For instance, the prompt “a child touching a bowl” generate images with high agreement (87%), while “a monkey touching an iguana” show worse results (11%). “A spoon in a cup” is easily generated, but not “a cup on a spoon”, reflecting effects of training data on model success.

Breaking the loop of black-and-white thinking

Beliefs are a building blocks of society and economy, thanks to their advantage of guiding consistent behaviour and judgments. Yet beliefs need revisions to be a key element of healthy cognition. “When the facts change, I change my mind. What do you do, sir?”, Keynes reportedly answered to an accusation of being inconsistent. Overly rigid beliefs are the basis of many destructive issues for individuals, nature, and society problems—prejudices, discrimination, conspiracy theories, psychiatric disorders. In principle, provision of counterevidence can destabilize rigid beliefs and lead to their revisions. But numerous experiences suggest that this is not that simple. Rigid beliefs show remarkable inertia and require cognitive resource for rational response, often not available.

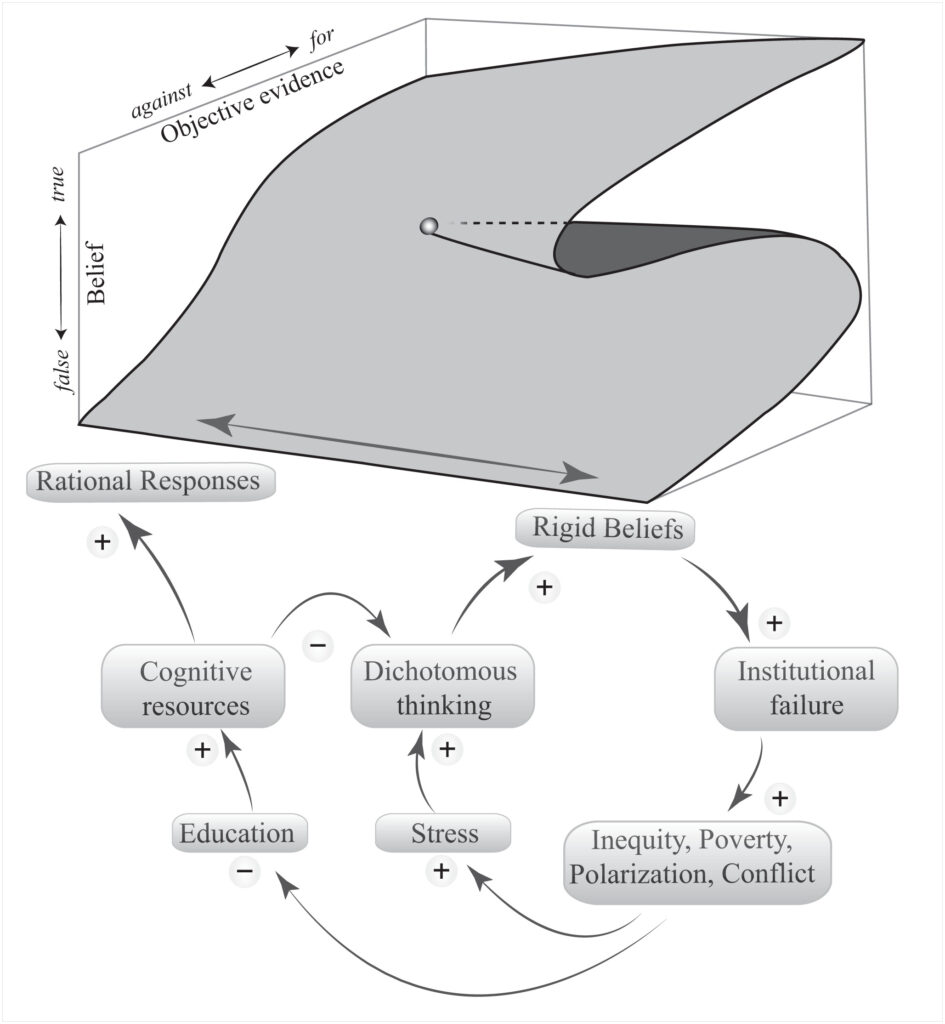
The paper “Belief traps: Tackling the inertia of harmful beliefs” provides explanation of this inertia using recent findings from neurobiology, psychiatry, and social sciences. The paper presents a unifying framework of how self-amplifying feedbacks shape the inertia of beliefs on levels ranging from neuronal networks to social systems. The chart summarizes it and shows how resilience of beliefs is boosted by stressful conditions.

Black-and-white thinking is a major risk factor for the formation of resilient beliefs. Lack of cognitive resources contributes to this dichotomous thinking. Stress could also exacerbate it. No surprise that conspiracy thinking and psychiatric disorders tend to peak during crises. On an individual level, false beliefs may lead to unwise decisions. On a societal level, unfounded beliefs could lead to behaviour with enormous costs for society and nature—beliefs in conspiracy theories may hamper the functioning of institutions; beliefs about intrinsic capacities related to groups (gender, race) perpetuate discrimination, entrench inequalities, result in underutilization of human potential; belief that some parts of animals—rhinoceros horn, shark fin—works as a medicine drive species extinct. Resulting inequality, poverty and lack of education could further promote stress and lack of cognitive resources, a driving factors of black-and-white thinking, thus closing the loop.

The paper suggests the most effective way to counteract this vicious cycle may be measures reducing social stress. Addressing social factors such as poverty, social cleavage, and lack of education could prevent the emergence of rigid beliefs. Finland national basic income experiment reported positive effects on the sense of well-being of recipients and feelings of trust in other people and the government. Most recent UNDP Human Security Report puts agency at the core of an expanded human security framework, reminding that wellbeing achievements alone are not enough, and help avoid the pitfalls of partial solutions, such as delivering protection with no attention to disempowerment or committing to solidarity while leaving some lacking protection.

Patterns and Drivers of Health Spending Efficiency

Health issues are high on public policy agenda. Health-related Sustainable Development Goals are yet to be achieved, COVID-19 pandemic is still on, and ageing population requires additional health services. Demands for health expenditures are at an all-time high all across the globe, while the fiscal space is limited. Not surprising, policymakers focus attention on ensuring that resources are used efficiently. This chart of the week shows losses—in terms of years of life and percent of GDP—due to health spending inefficiencies. It comes from the recent IMF Working Paper “Patterns and Drivers of Health Spending Efficiency”, which considers input- and output-oriented measures of (in)efficiency, depending on country distance from the frontier of expenditures-life expectancy.

The paper explores other patterns in efficiency across income groups, regions, and time, and the fiscal and years-of-life losses due to how health resources are spent. It goes further in exploring the question of drivers of health expenditure inefficiency, focusing on three major drivers: universal health coverage with essential services, income distribution, and corruption.

Universal health coverage is a crucial driver of health efficiency. If each country were to achieve, for each policy variable, the 75th percentile of its income group, low-income developing countries (LIDCs) would on average benefit from an increase of 3.4 years of life, while emerging markets (EMs) would gain 2.2 life years. Measured in expenditures savings, EMs and LIDCs to benefit from 0.39 and 0.37 percent of GDP. A more equitable distribution of income brings lower but still substantial gains in life expectancy by 1.7 and 2.1 years for EMs and LIDCs, respectively—or bring in savings of 0.17 and 0.12 percent of GDP. Better control of corruption is important, especially for EMs, which can benefit from an additional 1.6 years of life expectancy or avoid the waste of 0.27 percent of GDP in health spending. LIDCs gain 0.7 years of life expectancy or save 0.1 percent of GDP.